

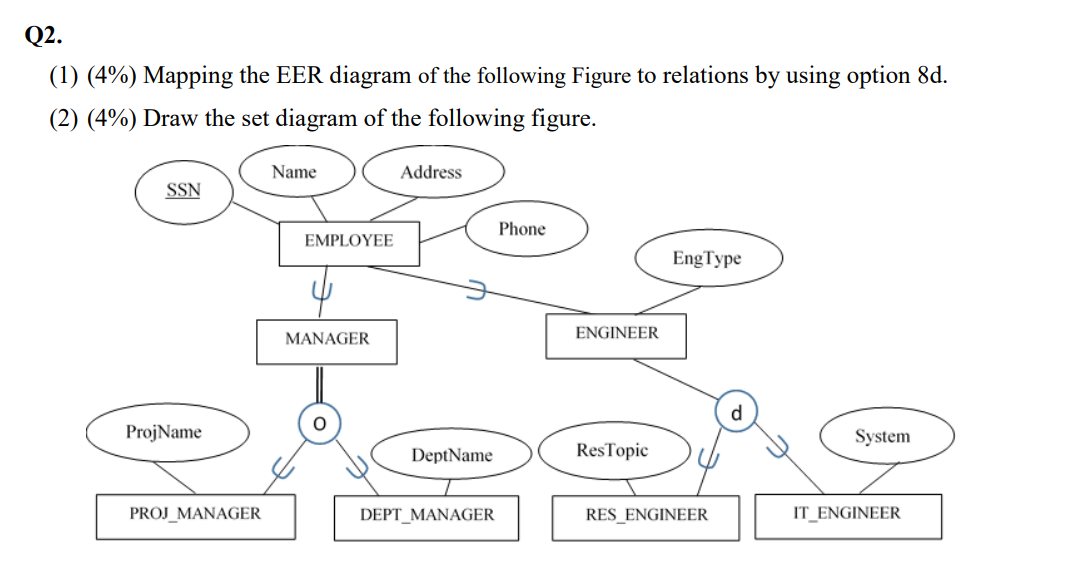
Question: Q 2 . ( 1 ) ( 4 % ) Mapping the EER diagram of the following Figure to relations by using option 8 d
Q
Mapping the EER diagram of the following Figure to relations by using option d
Draw the set diagram of the following figure
Step by Step Solution
There are 3 Steps involved in it
1 Expert Approved Answer
Step: 1 Unlock

Question Has Been Solved by an Expert!
Get step-by-step solutions from verified subject matter experts
Step: 2 Unlock
Step: 3 Unlock