

Question: Q 2 A: The table below gives the poverty level, unemployment rate, high school graduation rate, and divorce rate ( all in percentages ) of
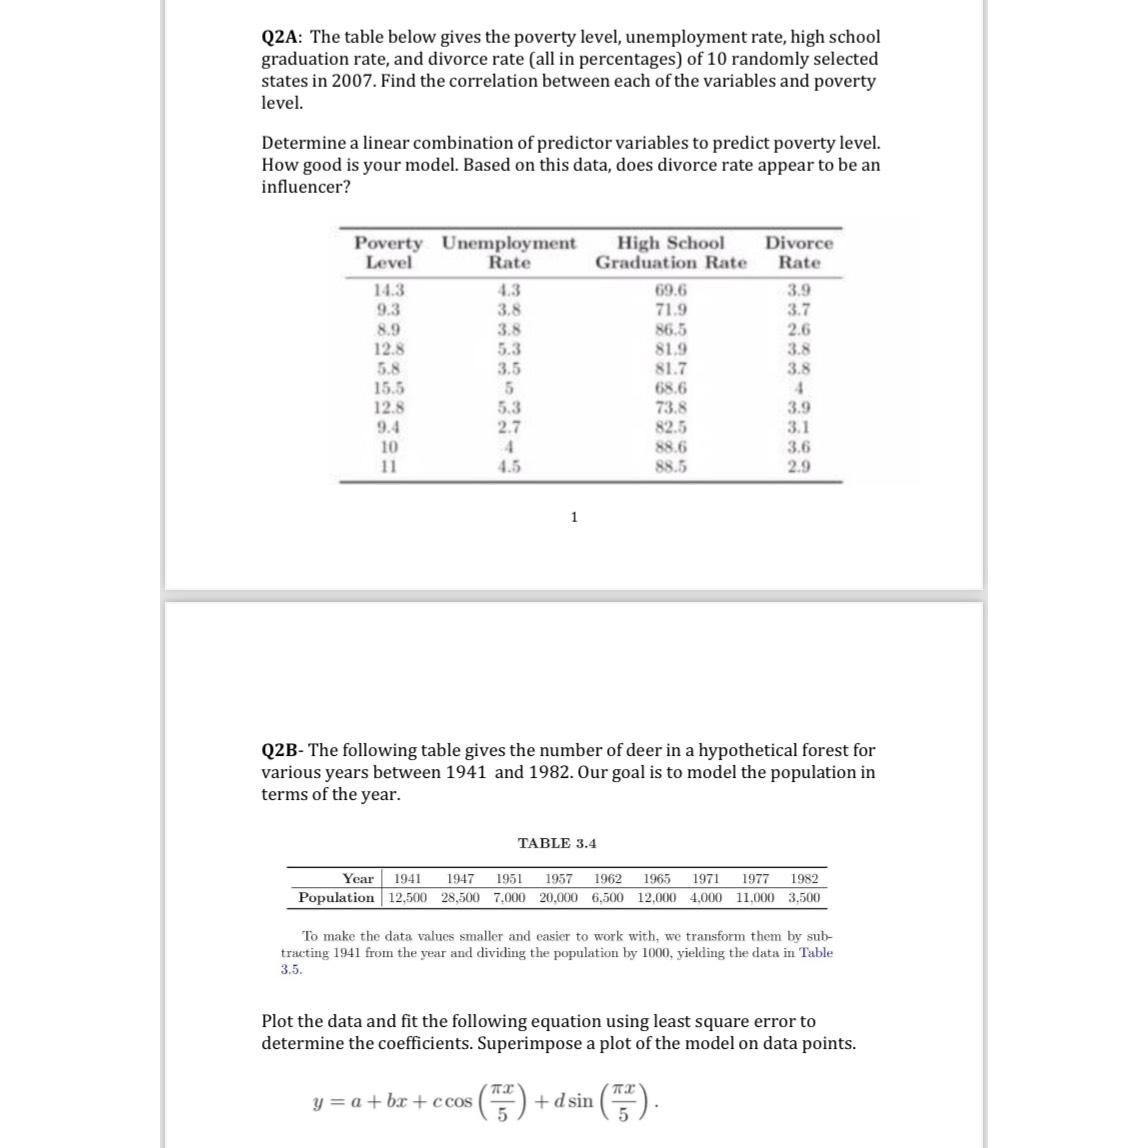
QA: The table below gives the poverty level, unemployment rate, high school graduation rate, and divorce rate all in percentages of randomly selected states in Find the correlation between each of the variables and poverty level.
Determine a linear combination of predictor variables to predict poverty level. How good is your model. Based on this data, does divorce rate appear to be an influencer?
tabletablePovertyLeveltableUnemploymentRatetableHigh SchoolGraduation RatetableDivorceRate
QB The following table gives the number of deer in a hypothetical forest for various years between and Our goal is to model the population in terms of the year.
TABLE
tableYearPopulation
To make the data values smaller and easier to work with, we transform them by subtracting from the year and dividing the population by yielding the data in Table
Plot the data and fit the following equation using least square error to determine the coefficients. Superimpose a plot of the model on data points.
ccosdsin
Step by Step Solution
There are 3 Steps involved in it
1 Expert Approved Answer
Step: 1 Unlock

Question Has Been Solved by an Expert!
Get step-by-step solutions from verified subject matter experts
Step: 2 Unlock
Step: 3 Unlock