

Question: Q. 2 (First time to fail to meet the standards, 40 pts). Consider a production process of light bulbs. With respect to the luminance values
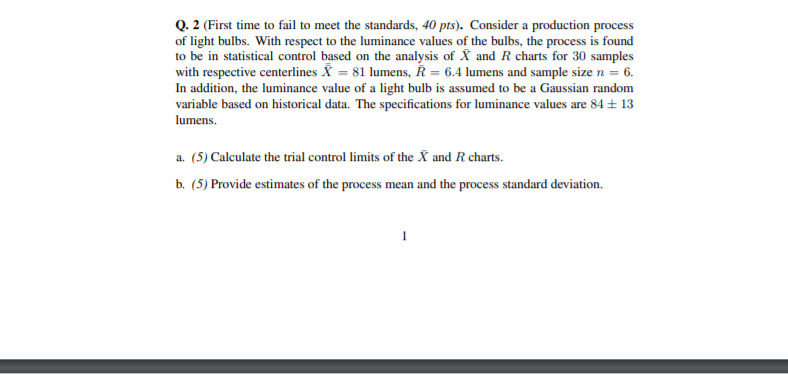
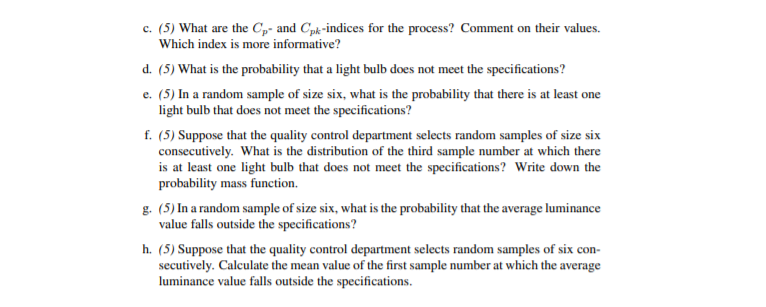
Q. 2 (First time to fail to meet the standards, 40 pts). Consider a production process of light bulbs. With respect to the luminance values of the bulbs, the process is found to be in statistical control based on the analysis of X and R charts for 30 samples with respective centerlines X = 81 lumens, R = 6.4 lumens and sample size n = 6. In addition, the luminance value of a light bulb is assumed to be a Gaussian random variable based on historical data. The specifications for luminance values are 84+ 13 lumens. a. (5) Calculate the trial control limits of the X and R charts. b. (5) Provide estimates of the process mean and the process standard deviation. c. (5) What are the Cp- and Cpk-indices for the process? Comment on their values. Which index is more informative? d. (5) What is the probability that a light bulb does not meet the specifications? e. (5) In a random sample of size six, what is the probability that there is at least one light bulb that does not meet the specifications? f. (5) Suppose that the quality control department selects random samples of size six consecutively. What is the distribution of the third sample number at which there is at least one light bulb that does not meet the specifications? Write down the probability mass function. g. (5) In a random sample of size six, what is the probability that the average luminance value falls outside the specifications? h. (5) Suppose that the quality control department selects random samples of six con secutively. Calculate the mean value of the first sample number at which the average luminance value falls outside the specifications. Q. 2 (First time to fail to meet the standards, 40 pts). Consider a production process of light bulbs. With respect to the luminance values of the bulbs, the process is found to be in statistical control based on the analysis of X and R charts for 30 samples with respective centerlines X = 81 lumens, R = 6.4 lumens and sample size n = 6. In addition, the luminance value of a light bulb is assumed to be a Gaussian random variable based on historical data. The specifications for luminance values are 84+ 13 lumens. a. (5) Calculate the trial control limits of the X and R charts. b. (5) Provide estimates of the process mean and the process standard deviation. c. (5) What are the Cp- and Cpk-indices for the process? Comment on their values. Which index is more informative? d. (5) What is the probability that a light bulb does not meet the specifications? e. (5) In a random sample of size six, what is the probability that there is at least one light bulb that does not meet the specifications? f. (5) Suppose that the quality control department selects random samples of size six consecutively. What is the distribution of the third sample number at which there is at least one light bulb that does not meet the specifications? Write down the probability mass function. g. (5) In a random sample of size six, what is the probability that the average luminance value falls outside the specifications? h. (5) Suppose that the quality control department selects random samples of six con secutively. Calculate the mean value of the first sample number at which the average luminance value falls outside the specifications
Step by Step Solution
There are 3 Steps involved in it

Get step-by-step solutions from verified subject matter experts