

Question: q 2 Paraphrasing Tool Natt Portfolio Robinho is flow chart Question completion Status The slope of the regression line would represent how much the SAT
q 2 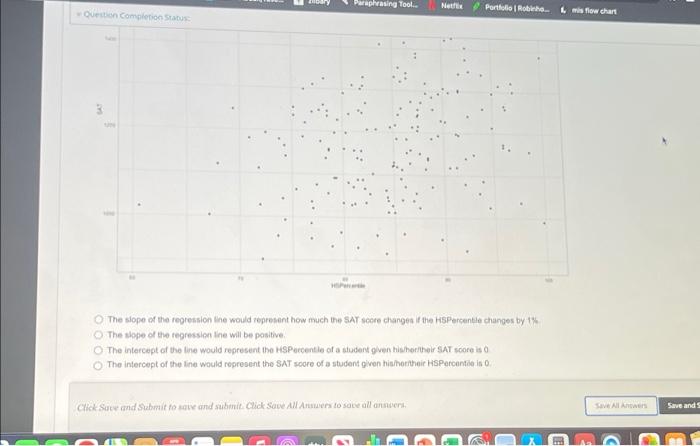
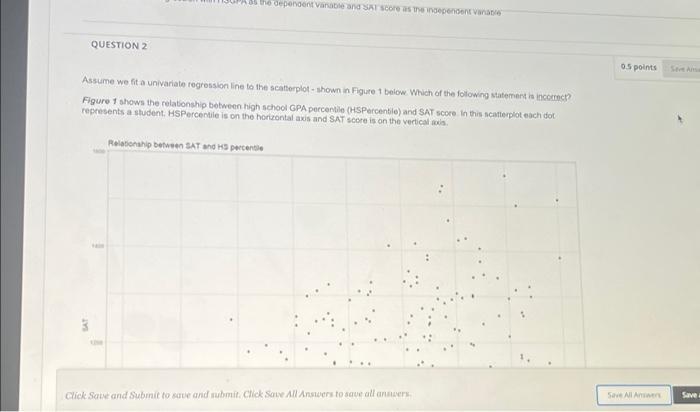
Paraphrasing Tool Natt Portfolio Robinho is flow chart Question completion Status The slope of the regression line would represent how much the SAT score changes if the Percentile changes by The slope of the regression line will be positive The intercept of the line would represent the Percentile of a student given hilwheelheir SAT score is 0 The intercept of the line would represent the SAT score of a student given his mother HSPoroanties Click Save and Submit ose and submit Click Save All Amero sau allanner Save All we Save and the dependentvare and SAT Score and QUESTION 2 05 points Assume we fit a univariate regression line to the scatterplot shown in Figure 1 below. Which of the following statement is incorrect? Figure 1 shows the relationship between high school GPA percentile (HSPercentile) and SAT score in this caterplot each dot represents a student. HS Percentile is on the horizontal axis and SAT score is on the vertical Relationship between SAT and 15 percentile Click Save and Submit to save and submit. Click Save All Ansters to save all anners Save AIA Save
Step by Step Solution
There are 3 Steps involved in it
1 Expert Approved Answer
Step: 1 Unlock

Question Has Been Solved by an Expert!
Get step-by-step solutions from verified subject matter experts
Step: 2 Unlock
Step: 3 Unlock