

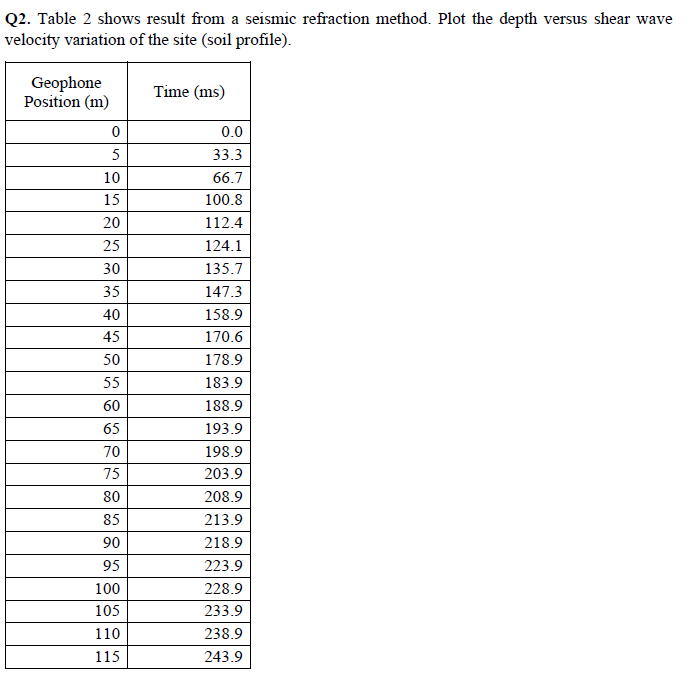
Question: Q 2 . Table 2 shows result from a seismic refraction method. Plot the depth versus shear wave velocity variation of the site ( soil
Q Table shows result from a seismic refraction method. Plot the depth versus shear wave
velocity variation of the site soil profile
Step by Step Solution
There are 3 Steps involved in it
1 Expert Approved Answer
Step: 1 Unlock

Question Has Been Solved by an Expert!
Get step-by-step solutions from verified subject matter experts
Step: 2 Unlock
Step: 3 Unlock