

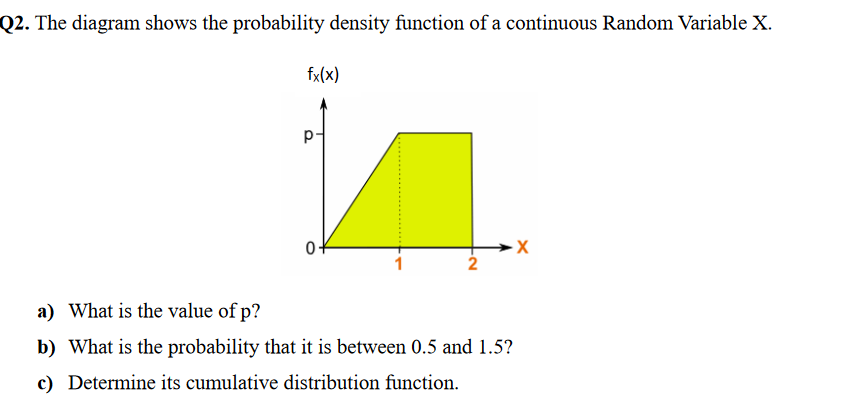
Question: Q 2 . The diagram shows the probability density function of a continuous Random Variable x . a ) What is the value of p
Q The diagram shows the probability density function of a continuous Random Variable
a What is the value of
b What is the probability that it is between and
c Determine its cumulative distribution function.
Step by Step Solution
There are 3 Steps involved in it
1 Expert Approved Answer
Step: 1 Unlock

Question Has Been Solved by an Expert!
Get step-by-step solutions from verified subject matter experts
Step: 2 Unlock
Step: 3 Unlock