

Question: Q 2 . The following data are based on a month of samples, each with n = 6 , taken from a process that produces
Q The following data are based on a month of samples, each with taken from a process
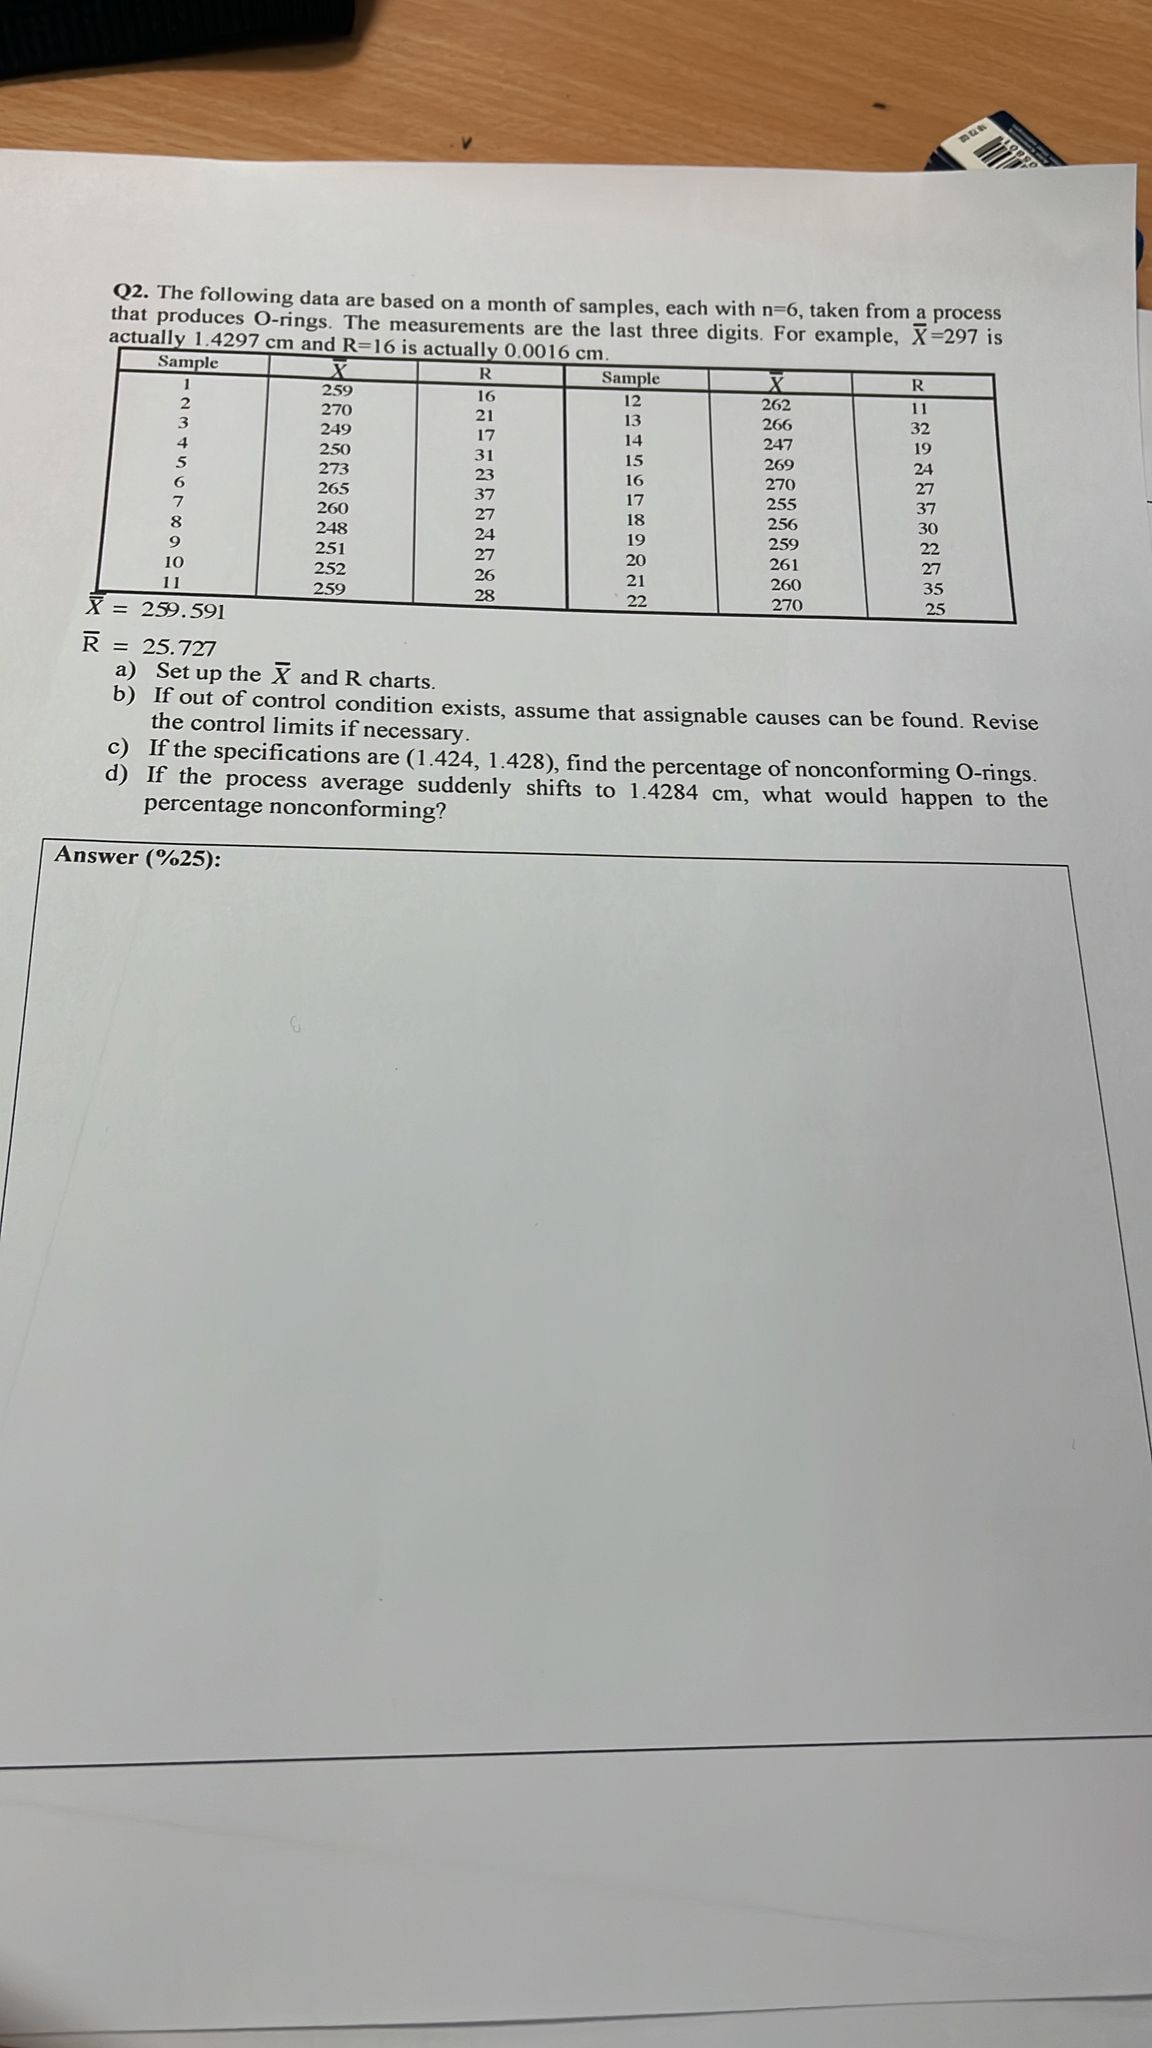
that produces Orings. The measurements are the last three digits. For example, is
actually and is actually
a Set up the and charts.
b If out of control condition exists, assume that assignable causes can be found. Revise
the control limits if necessary.
c If the specifications are find the percentage of nonconforming rings.
d If the process average suddenly shifts to what would happen to the
percentage nonconforming?
Answer :
Step by Step Solution
There are 3 Steps involved in it
1 Expert Approved Answer
Step: 1 Unlock

Question Has Been Solved by an Expert!
Get step-by-step solutions from verified subject matter experts
Step: 2 Unlock
Step: 3 Unlock