

Question: Q 2 / The table below shows the electric power production plants in Iraq and their design capacity for the years ( 2 0 2
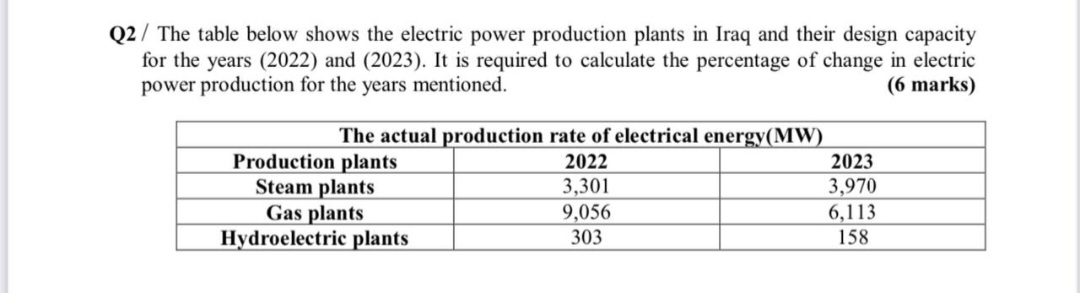
Q The table below shows the electric power production plants in Iraq and their design capacity for the years and It is required to calculate the percentage of change in electric power production for the years mentioned.
marks
tableThe actual production rate of electrical energyMWProduction plants,
Step by Step Solution
There are 3 Steps involved in it
1 Expert Approved Answer
Step: 1 Unlock

Question Has Been Solved by an Expert!
Get step-by-step solutions from verified subject matter experts
Step: 2 Unlock
Step: 3 Unlock