

Question: q 20 please answer this question ASAP In an existing process, we have found that the lower and upper control limits for X-bar chart are
q 20 please answer this question ASAP 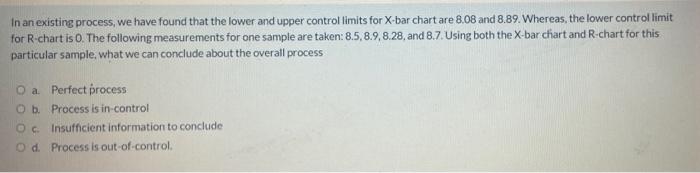
In an existing process, we have found that the lower and upper control limits for X-bar chart are 8.08 and 8.89. Whereas the lower controllimit for R-chart is 0. The following measurements for one sample are taken: 8.5,8.9.8.28, and 8.7. Using both the X-bar chart and R-chart for this particular sample, what we can conclude about the overall process O a Perfect process O b. Process is in control Ocinsufficient information to conclude Od Process is out-of-control Step by Step Solution
There are 3 Steps involved in it
1 Expert Approved Answer
Step: 1 Unlock

Question Has Been Solved by an Expert!
Get step-by-step solutions from verified subject matter experts
Step: 2 Unlock
Step: 3 Unlock