

Question: Q [23 marks] Claims In this exercise we will look at some data from Baxter et al. (1980) Transactions 21 Congress of Actuaries 2-3, 11-29.
![Q [23 marks] Claims In this exercise we will look at](https://dsd5zvtm8ll6.cloudfront.net/si.experts.images/questions/2024/10/670a0314a21c2_396670a03147fe60.jpg)
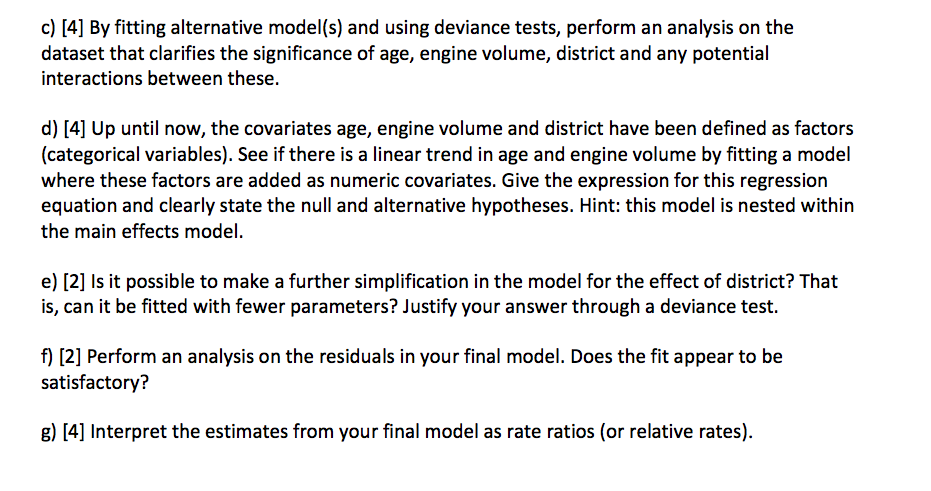
Q [23 marks] Claims In this exercise we will look at some data from Baxter et al. (1980) Transactions 21 Congress of Actuaries 2-3, 11-29. The dataset includes claims in a portfolio of insured cars from an English insurance company. Number of claims and policies are recorded and divided in three classication factors with four levels each. The data (64 observations] are available in the le c|aims.txt on the course webpage. The available variables are: - age - the age of policy holder (1 = below 25, 2: 25-29, 3: 30-35, 4 = over 35) 0 volume - the engine volume in litres (1 = below 1, 2: 1-1.5, 3= 1.5-2, 4 = over 2) - district - the geographical region {4: London and other large cities, 1-3 unnamed other districts] - insured - the number of insured policies in each group I claims - the number of claims led a) [3] What assumptions on the distribution are reasonable with respect to number of claims? Write down the expression for the main effects model including age, volume and district. What variable should be used as the offset term and why? b) [4] Fit the main effects model given in (a). Based on this model: i) Estimate the relative rate of claims for policies held by individuals over age 35 versus those held by individuals below age 25. Provide a non-technical interpretation of your estimate along with a 95% confidence interval. ii) Estimate the claim rate of an insured person in age category 25-29 years old, car with engine volume 1.5-2 litres and living in London. Also estimate a 95% condence interval for this rate. c) [4] By tting alternative modelfs) and using deviance tests, perform an analysis on the dataset that clarifies the signicance of age, engine volume, district and any potential interactions between these. d) [4] Up until now, the covariates age, engine volume and district have been dened as factors {categorical variables]. See if there is a linear trend in age and engine volume by tting a model where these factors are added as numeric covariates. Give the expression for this regression equation and clearly state the null and alternative hypotheses. Hint: this model is nested within the main effects model. e) [2] Is it possible to make a further simplification in the model for the effect of district? That is, can it be tted with fewer parameters? Justify your answer through a deviance test. f) [2] Perform an analysis on the residuals in your final model. Does the t appear to be satisfactory? g} [4] Interpret the estimates from your nal model as rate ratios (or relative rates)
Step by Step Solution
There are 3 Steps involved in it

Get step-by-step solutions from verified subject matter experts