

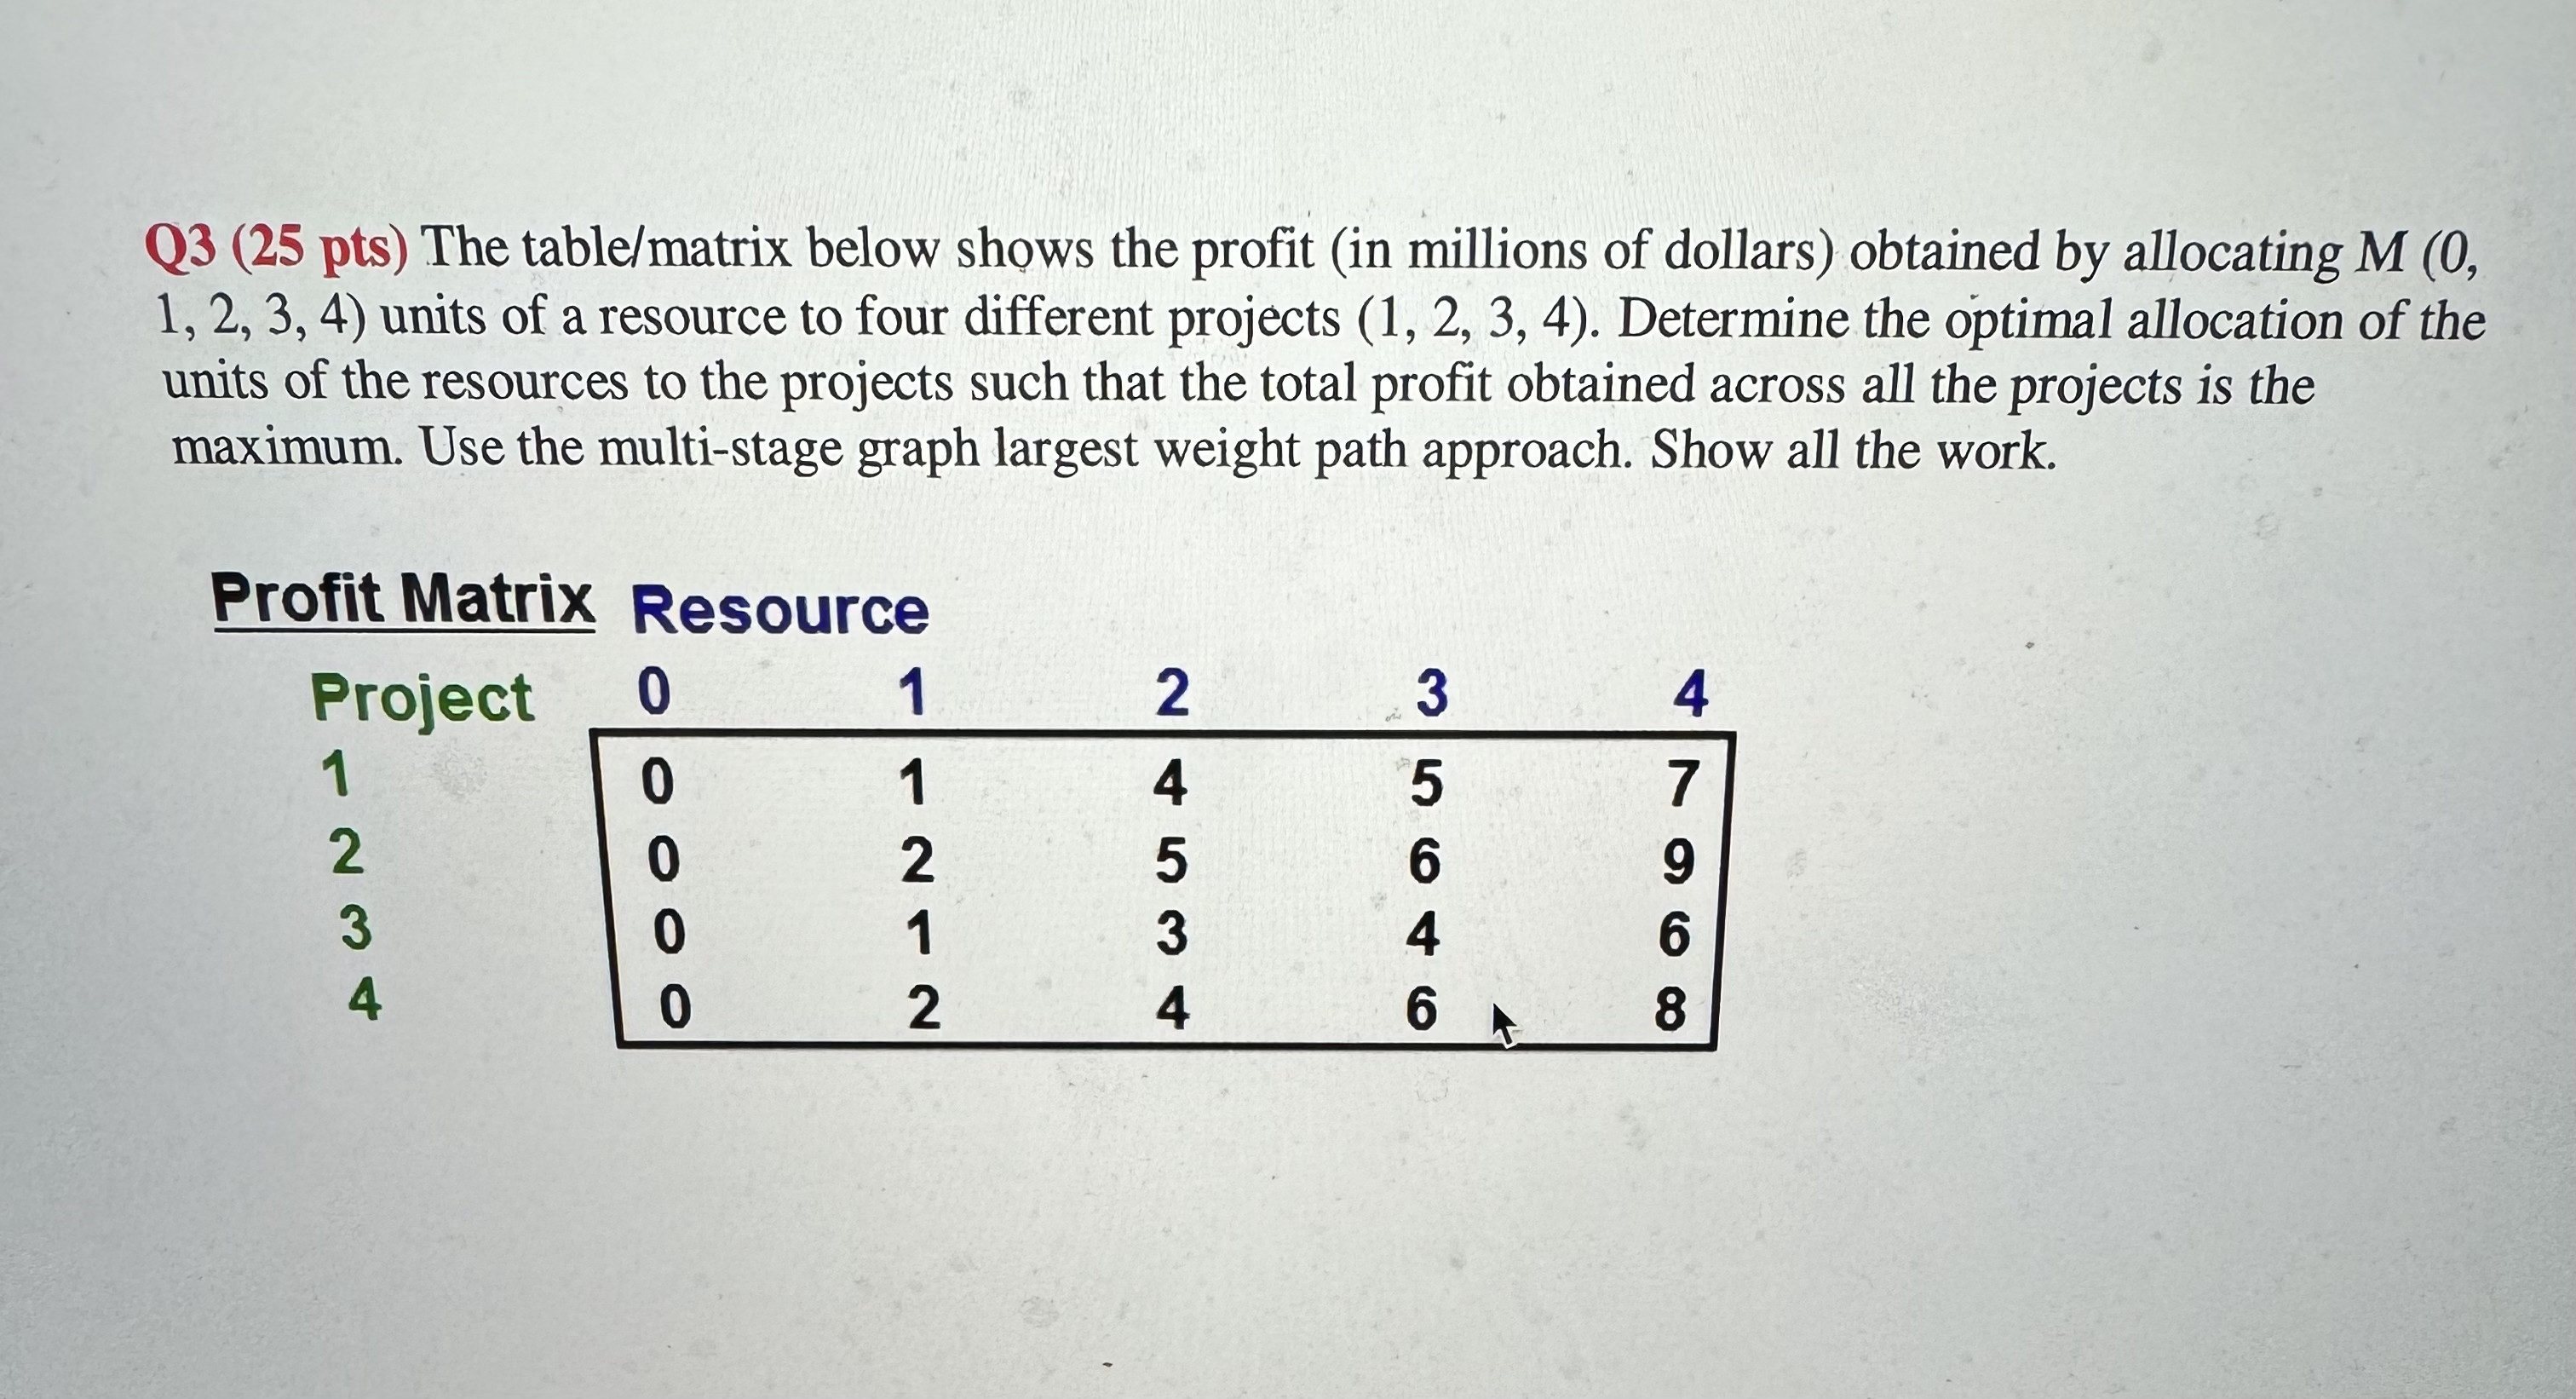
Question: Q 3 ( 2 5 pts ) The table / matrix below shows the profit ( in millions of dollars ) obtained by allocating ,
Q pts The tablematrix below shows the profit in millions of dollars obtained by allocating units of a resource to four different projects Determine the optimal allocation of the units of the resources to the projects such that the total profit obtained across all the projects is the maximum. Use the multistage graph largest weight path approach. Show all the work.
Profit Matrix Resource
tabletableProject
Step by Step Solution
There are 3 Steps involved in it
1 Expert Approved Answer
Step: 1 Unlock

Question Has Been Solved by an Expert!
Get step-by-step solutions from verified subject matter experts
Step: 2 Unlock
Step: 3 Unlock