

Question: Q . 3 : In the next graph, end - of - year return on assets ( ROA ) and return on equity ( ROE
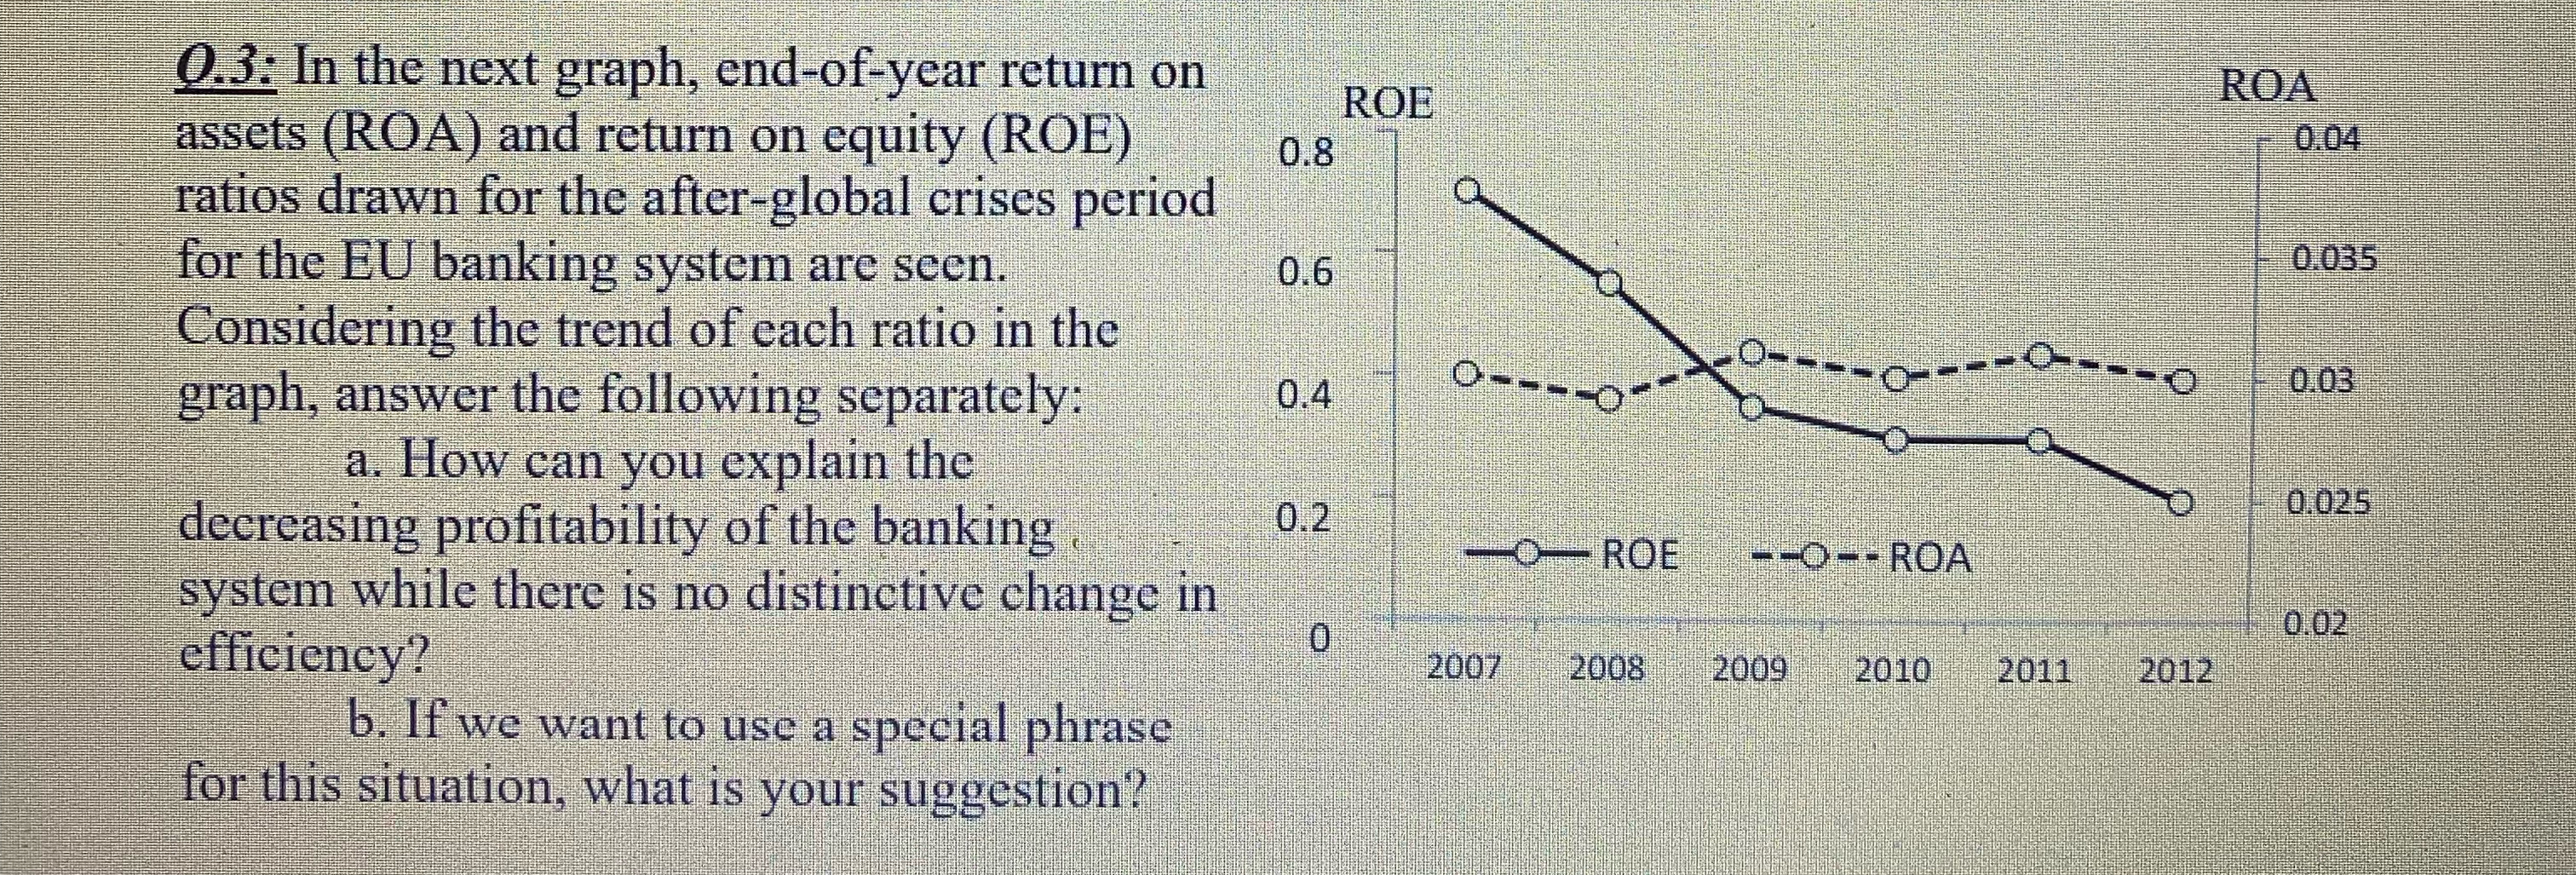
Q: In the next graph, endofyear return on assets ROA and return on equity ROE ratios drawn for the afterglobal crises period for the EU banking system are seen. Considering the trend of each ratio in the graph, answer the following separately:
a How can you explain the decreasing profitability of the banking system while there is no distinctive change in efficiency?
b If we want to use a special phrase for this situation, what is your suggestion?
Step by Step Solution
There are 3 Steps involved in it
1 Expert Approved Answer
Step: 1 Unlock

Question Has Been Solved by an Expert!
Get step-by-step solutions from verified subject matter experts
Step: 2 Unlock
Step: 3 Unlock