

Question: Q 3 ) Solve the example problem shown in Figure of an intersection. If the speed - dens ty relationship is linear and flow states
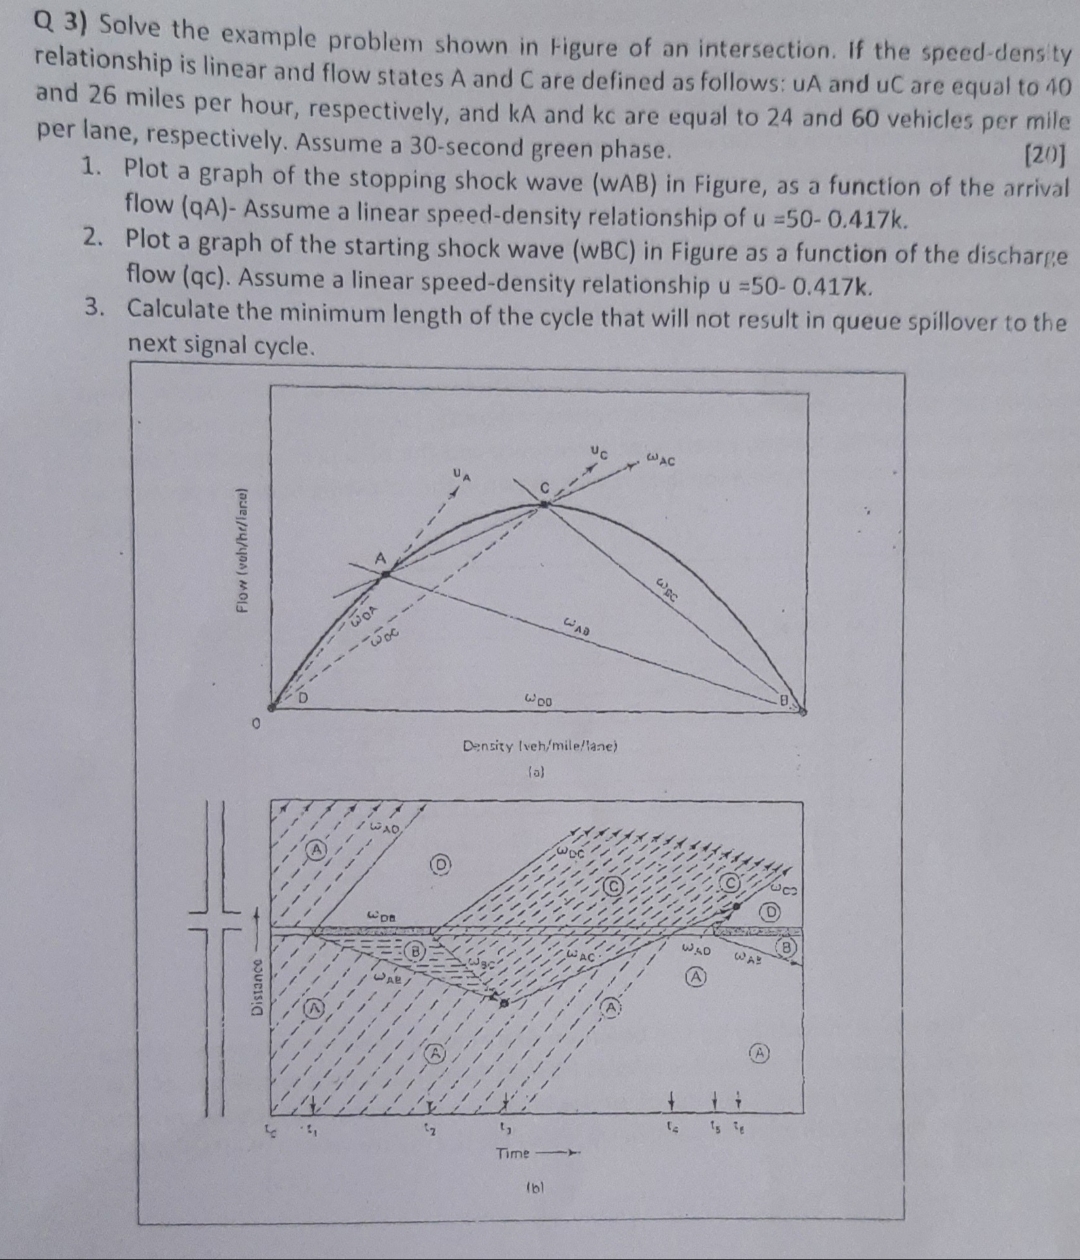
Q Solve the example problem shown in Figure of an intersection. If the speeddens ty relationship is linear and flow states A and are defined as follows: and are equal to and miles per hour, respectively, and and are equal to and vehicles per mile per lane, respectively. Assume a second green phase.
Plot a graph of the stopping shock wave WAB in Figure, as a function of the arrival flow qAAssume a linear speeddensity relationship of
Plot a graph of the starting shock wave wBC in Figure as a function of the discharge flow qc Assume a linear speeddensity relationship
Calculate the minimum length of the cycle that will not result in queue spillover to the next signal cycle.
a
Step by Step Solution
There are 3 Steps involved in it
1 Expert Approved Answer
Step: 1 Unlock

Question Has Been Solved by an Expert!
Get step-by-step solutions from verified subject matter experts
Step: 2 Unlock
Step: 3 Unlock