

Question: Q ( 4 ) . a . The table below shows the monthly average flow rates ( m 3 s ) measured at a stream
Q
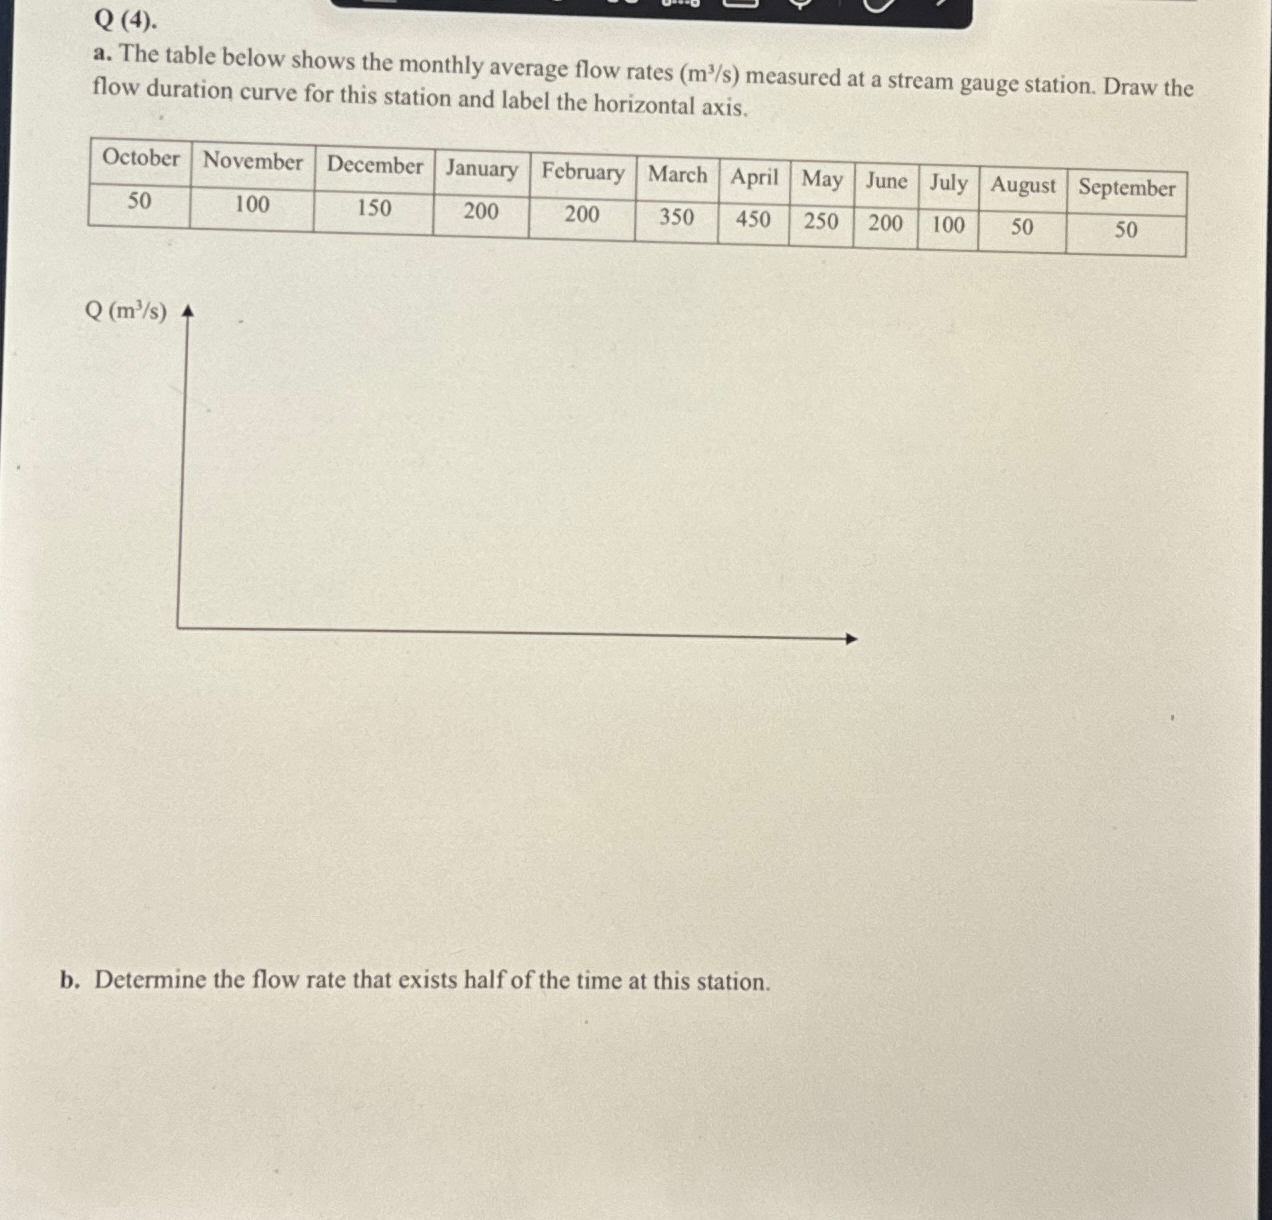
a The table below shows the monthly average flow rates measured at a stream gauge station. Draw the flow duration curve for this station and label the horizontal axis.
tableOctoberNovember,December,January,February,March,April,May,June,July,August,September
b Determine the flow rate that exists half of the time at this station.
Step by Step Solution
There are 3 Steps involved in it
1 Expert Approved Answer
Step: 1 Unlock

Question Has Been Solved by an Expert!
Get step-by-step solutions from verified subject matter experts
Step: 2 Unlock
Step: 3 Unlock