

Question: Q 4 Filtration data is collected and plotted, as shown in the figure below. What is the specific cake resistance ( ) and the filter
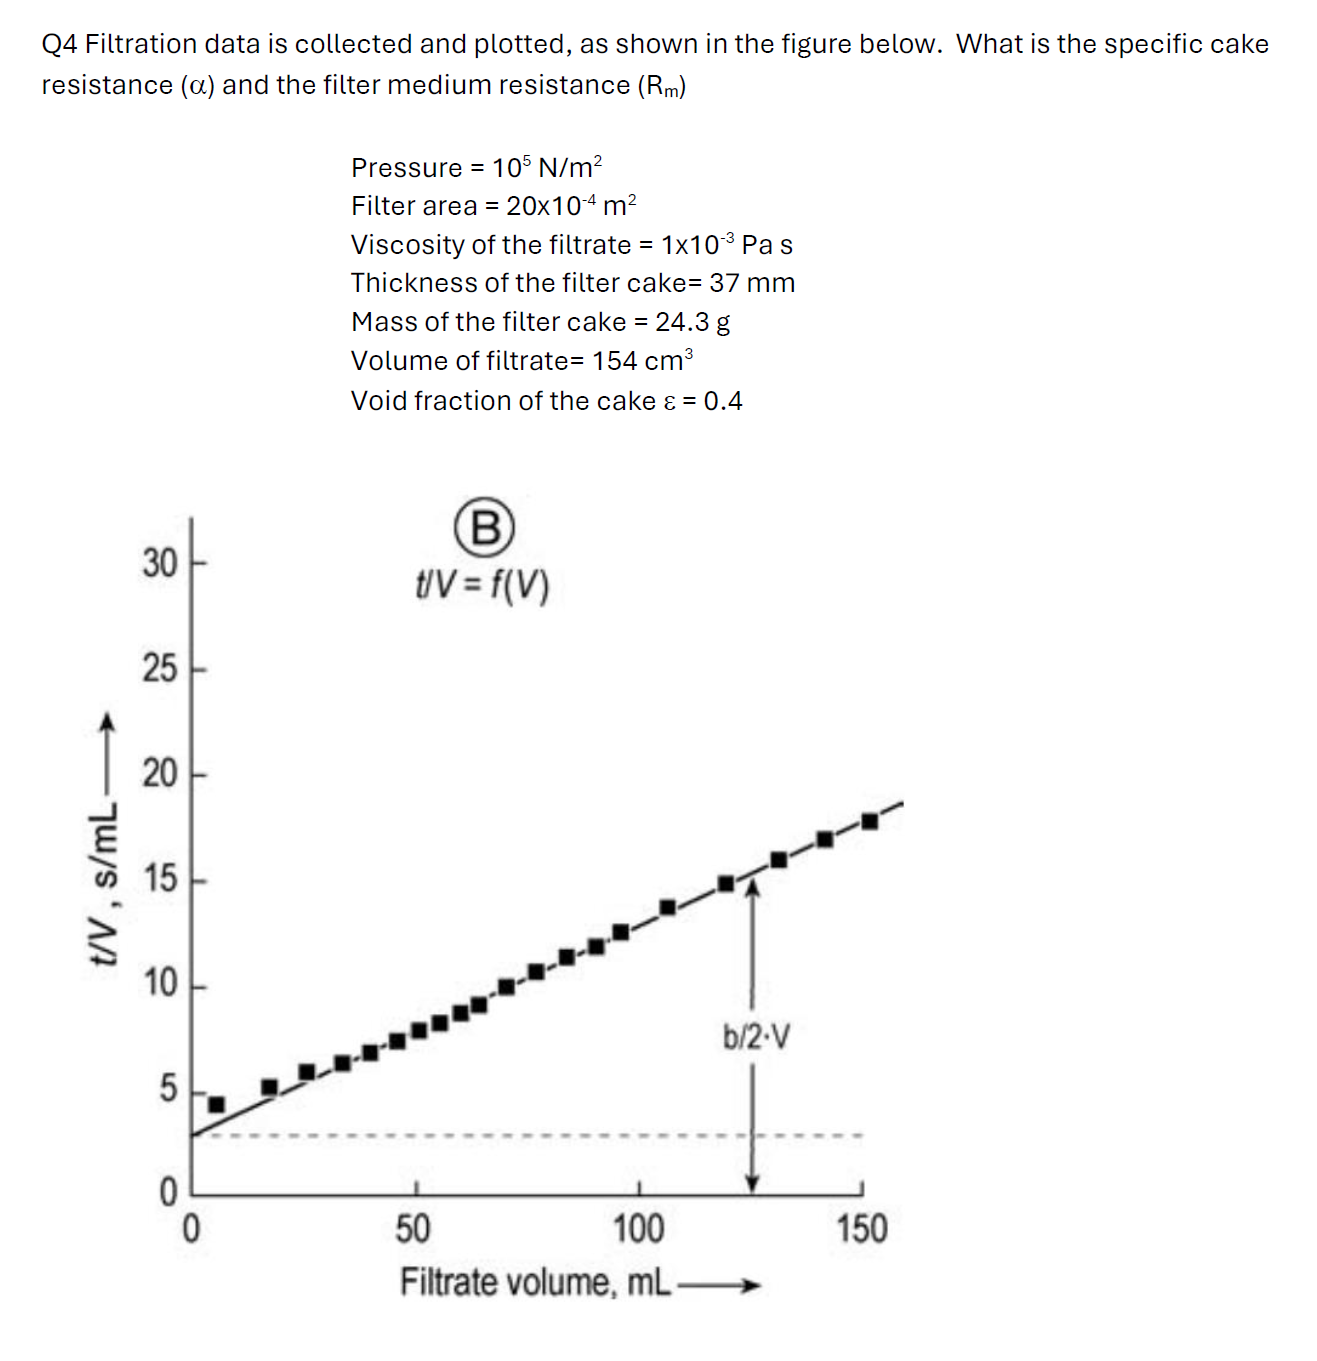
Q Filtration data is collected and plotted, as shown in the figure below. What is the specific cake
resistance and the filter medium resistance
Pressure
Filter area
Viscosity of the filtrate Pas
Thickness of the filter cake
Mass of the filter cake
Volume of filtrate
Void fraction of the cake
Please give a detailed solution to this problem, thanks
Step by Step Solution
There are 3 Steps involved in it
1 Expert Approved Answer
Step: 1 Unlock

Question Has Been Solved by an Expert!
Get step-by-step solutions from verified subject matter experts
Step: 2 Unlock
Step: 3 Unlock