

Question: Q 4 . Machine Learning Evaluation ( ROC Curve ) ( Total 1 2 pt ) You have been asked to develop a classification model
Q Machine Learning Evaluation ROC CurveTotal pt
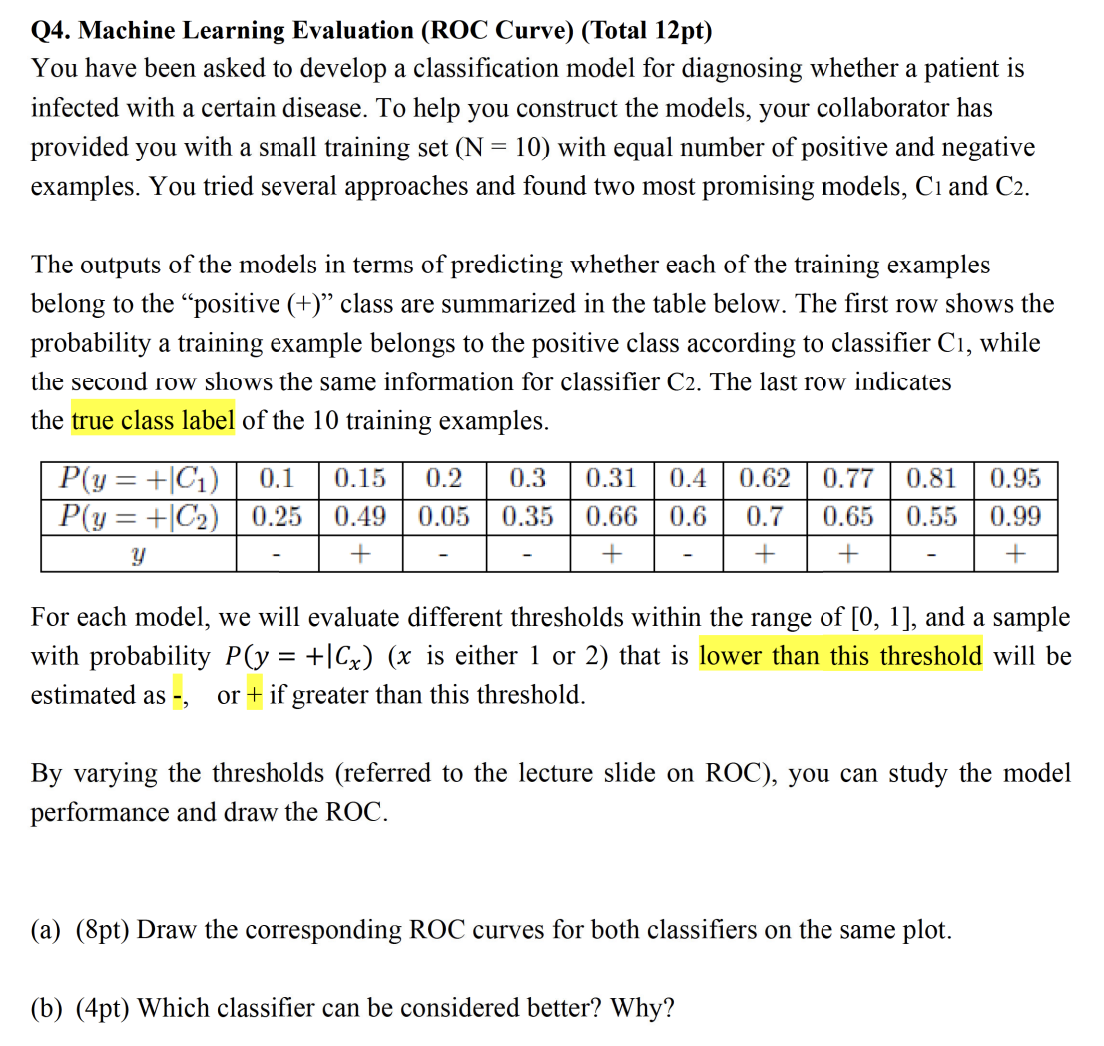
You have been asked to develop a classification model for diagnosing whether a patient is infected with a certain disease. To help you construct the models, your collaborator has provided you with a small training set mathrmN with equal number of positive and negative examples. You tried several approaches and found two most promising models, mathrmC and mathrmC
The outputs of the models in terms of predicting whether each of the training examples belong to the "positive class are summarized in the table below. The first row shows the probability a training example belongs to the positive class according to classifier mathrmC while the second row shows the same information for classifier C The last row indicates the true class label of the training examples.
For each model, we will evaluate different thresholds within the range of and a sample with probability Pleftymid Cxright x is either or that is lower than this threshold will be estimated asquad or if greater than this threshold.
By varying the thresholds referred to the lecture slide on ROC you can study the model performance and draw the ROC.
apt Draw the corresponding ROC curves for both classifiers on the same plot.
bpt Which classifier can be considered better? Why?
Step by Step Solution
There are 3 Steps involved in it
1 Expert Approved Answer
Step: 1 Unlock

Question Has Been Solved by an Expert!
Get step-by-step solutions from verified subject matter experts
Step: 2 Unlock
Step: 3 Unlock