

Question: Q - 4 Plot the graph of y = cos 3 x for 0 x 1 using increments of 0 . 0 1 for x
Q Plot the graph of ycos x for x using increments of for x
a Put a title as Graph of ycospi x for your plot label the x axes as x axis label y
axis as y axis
b Grid your plot
c Save your plot as Figfig. Close the plot you have drawn and plot the same graph
with red dashed line.
Hint: Use help plot command for different line styles
d Plot the graph of zsinpi x on the same figure with green solid line.
e Change the x axis boundaries as and y axis boundaries as
f Title your plot as Multi plot label x axis as x axis label y axis as y axis put a
descriptive legend for red dashed line as Cos curve and green solid line as Sin curve
g Save your plot as FigfigMECH
HW
Q
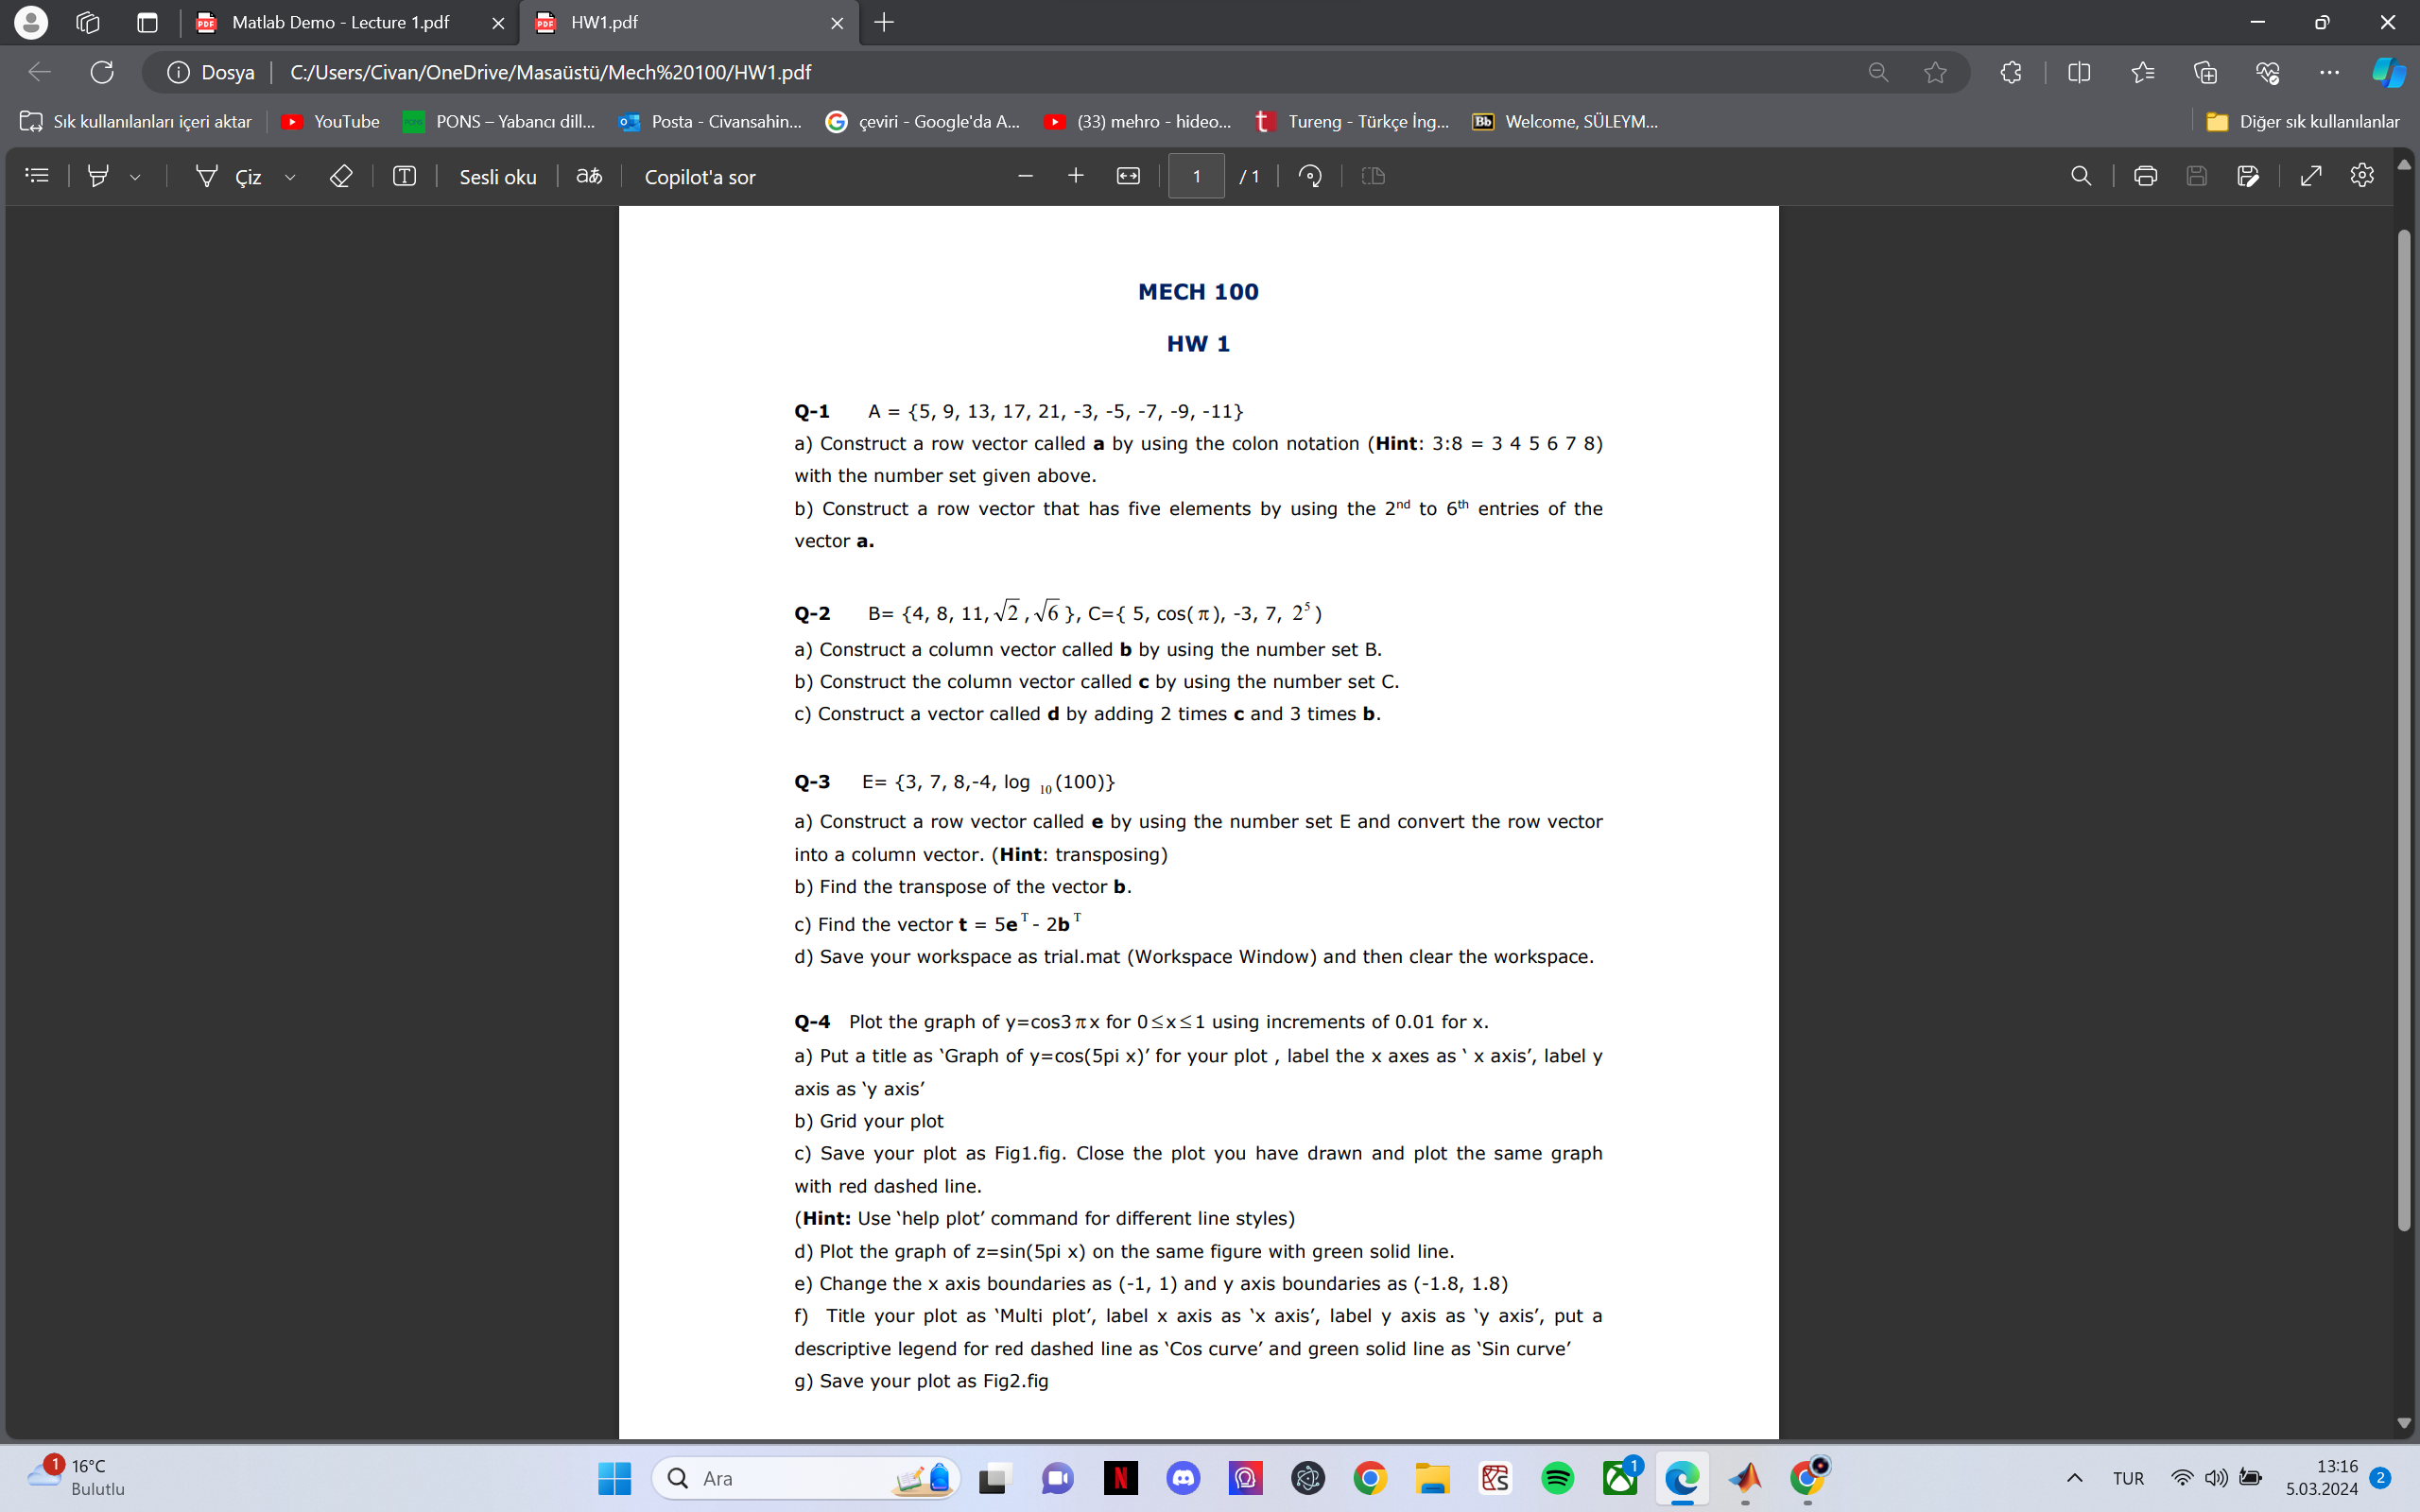
a Construct a row vector called a by using the colon notation Hint: :
with the number set given above.
b Construct a row vector that has five elements by using the to entries of the
vector a
Q
a Construct a column vector called by using the number set
b Construct the column vector called by using the number set
c Construct a vector called by adding times and times
Q
a Construct a row vector called by using the number set and convert the row vector
into a column vector. Hint: transposing
b Find the transpose of the vector
c Find the vector
d Save your workspace as trial.mat Workspace Window and then clear the workspace.
Q Plot the graph of for using increments of for
a Put a title as 'Graph of for your plot, label the axes as axis', label
axis as y axis'
b Grid your plot
c Save your plot as Figfig. Close the plot you have drawn and plot the same graph
with red dashed line.
Hint: Use 'help plot' command for different line styles
d Plot the graph of on the same figure with green solid line.
e Change the axis boundaries as and axis boundaries as
f Title your plot as 'Multi plot', label axis as axis', label axis as axis', put a
descriptive legend for red dashed line as 'Cos curve' and green solid line as 'Sin curve'
g Save your plot as Figfig
JUST Q
Step by Step Solution
There are 3 Steps involved in it
1 Expert Approved Answer
Step: 1 Unlock

Question Has Been Solved by an Expert!
Get step-by-step solutions from verified subject matter experts
Step: 2 Unlock
Step: 3 Unlock