

Question: Q 4 . Support Vector Machines ( SVM ) is a supervised learning algorithm, which can be applicable to both classification and regression. The data
Q Support Vector Machines SVM is a supervised learning algorithm, which can be applicable to both classification and regression. The data set provided contains normal and fraudulent transactions in excel file WeekFrauddata in sheets FraudTrain and FraudTest Using Support Machine Model SVM predict whether the transactions are Normal or Fraudulent based on the features of the transactions in the dataset.
Use isfraud as target variable and features as independent variables. Convert all textual categorical variables to numeric, and clean data if necessary. For SVM model, add Vaimal Machine Learning Addin
Note: Install Vaimal Addin attached with the assignment using installation instructions below and detailed instruction in the Manual.
Please follow below process for model development:
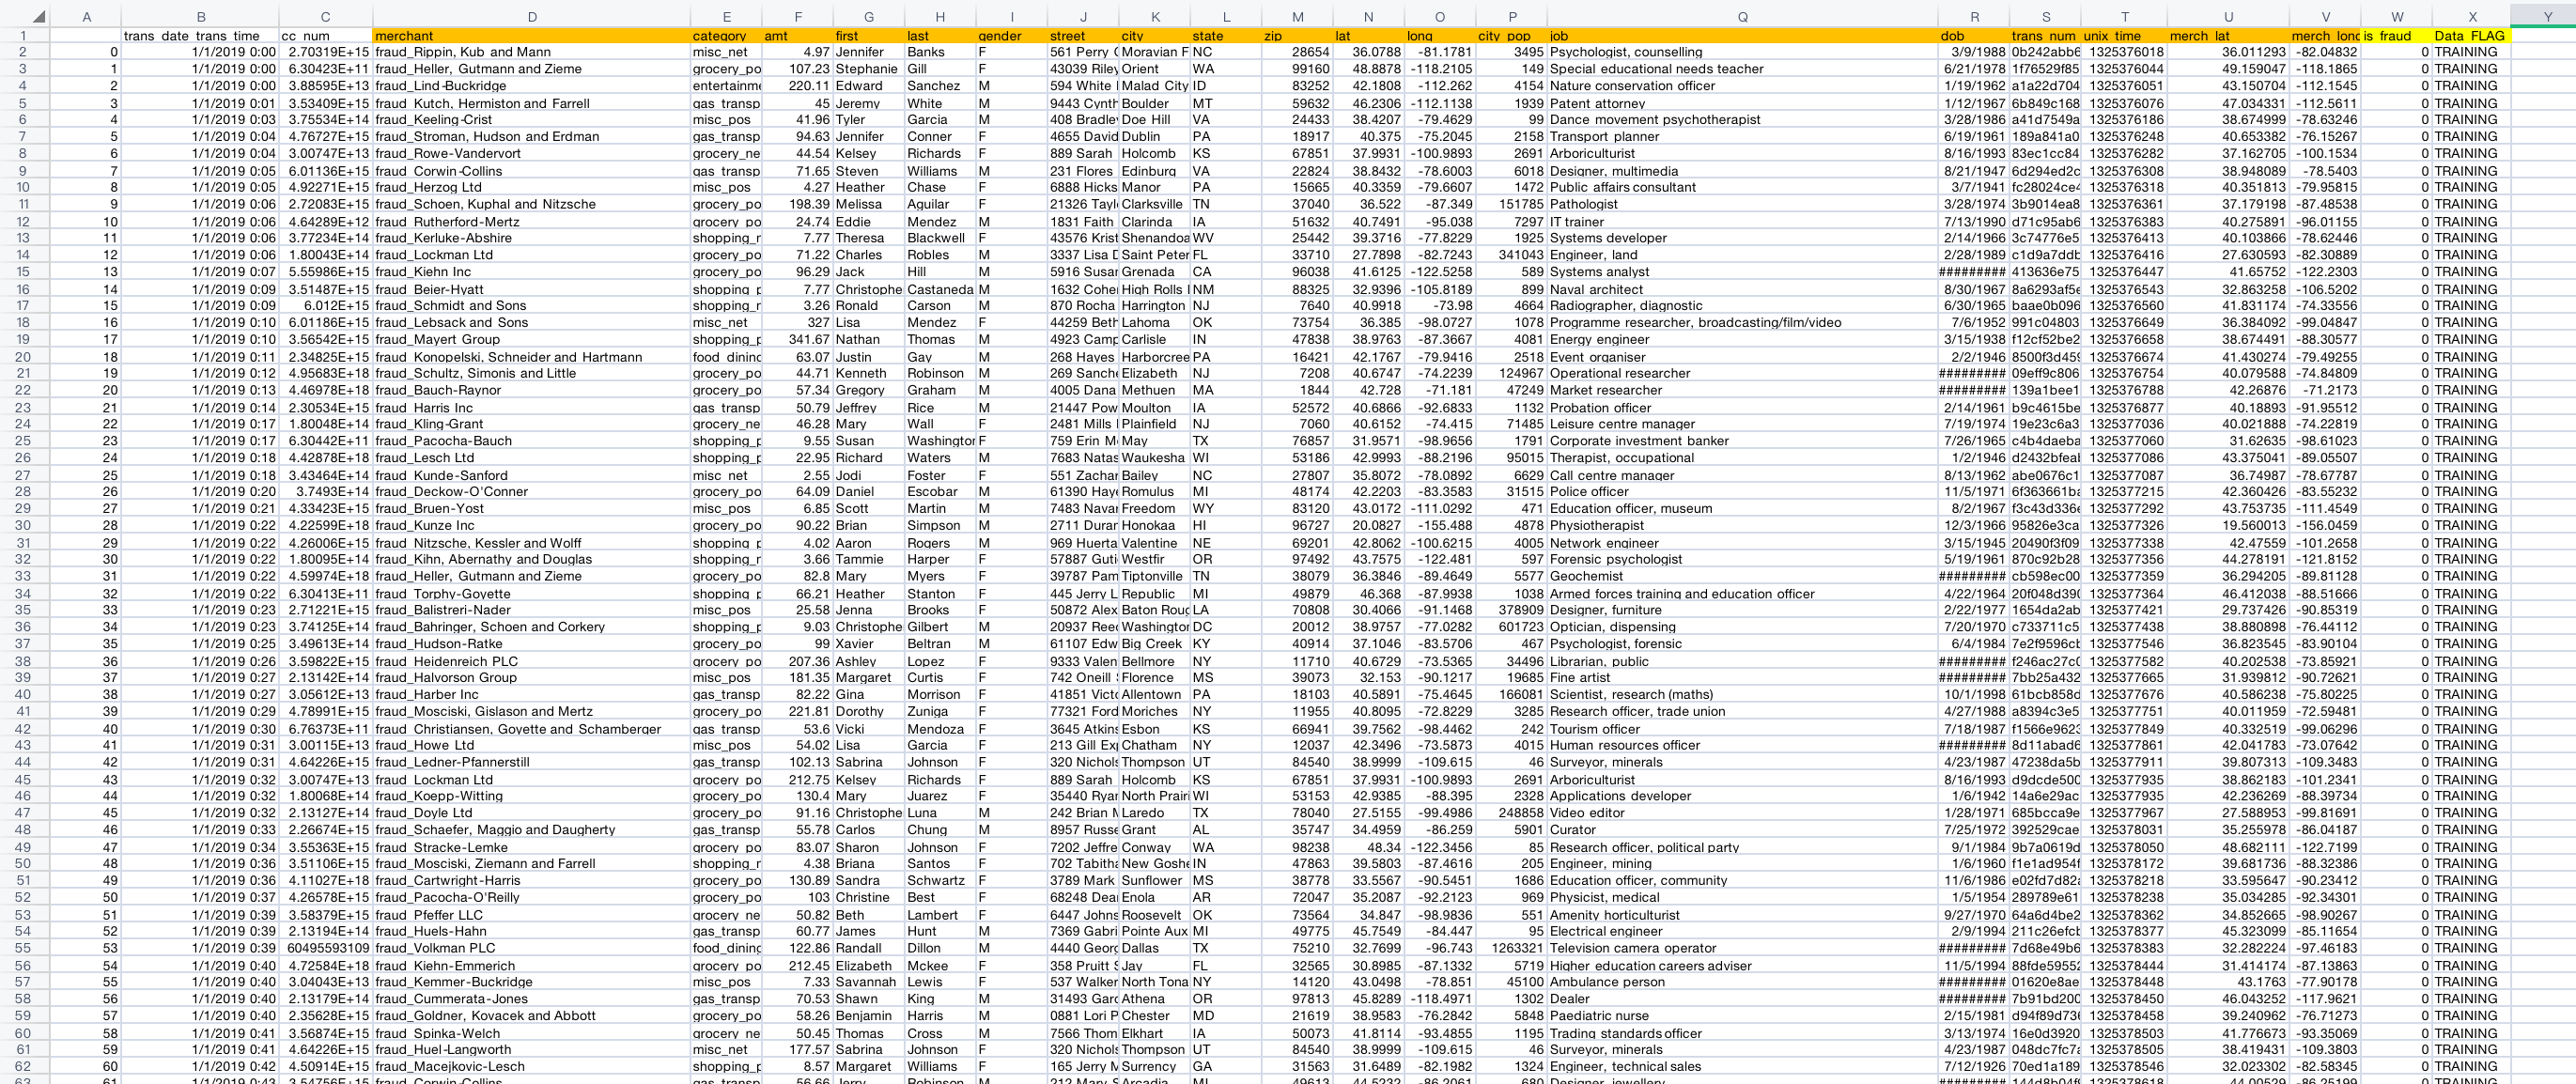
Import or load Data: Place data in an Excel worksheet.
Perform Data Preprocessing: Deal with missing data, data normalization, and encoding categorical inputs.
Vaimal has several utilities for preprocessing data such as Data Manager.
Select a Model: To use and design it Select which model to use and the design parameters.
Train the Model: Using training data with known outputs, train the model.
Test the Model Using different data than the training data, test the models ability to predict versus known outputs.
Prediction: Use the model to make predictions of data with unknown output.
Input Variables:
transdatetranstime, ccnum, first, last, merchant, category, amt, gender, street, city, state, zip, lat, long, citypop, job, unixtime, merchlat, and merchlong. Please convert categorical variables to Numbers such as Gender, and category etc. You can drop unwanted columns and use below columns as INPUT columns:
Output Variables:
Please use column isfraud as a target variable.
Data Flag for Training or Testing:
The column DataFLAG differentiates the data as Training and Testing. Please supply input to the model as per inputs.
a Provide descriptive measures of column amt: count, Min, Max, Mean, and Std deviation. Write the count of fraudulent and normal transactions.
b Show graph of Normalized frequency for columns category and Isfraud to show frequency for normal and fraudulent transactions.
c Perform Error analysis using confusion matrix, which is created with four categories true positives TP false positives FP true negatives TN and false negatives FN
Precision P TPTP FP
Recall R TPTP FN
Accuracy TP TNTP FP TN FN
F score P RP R
d Based on the features below, predict the status of the transaction if it is Fraud:
transdatetranstime: :
ccnum: E
merchant: fraudTorphyGoyette
category: shoppingpos
amt:
first: Jason, last: Johnson, gender: M
street: Thomas Park, city: Craig
state: AK zip:
lat: long: citypop:
job: Commissioning editor, dob:
transnum: fffebabccabd
unixtime:
merchlat: merchlong:
isfraud:
Step by Step Solution
There are 3 Steps involved in it
1 Expert Approved Answer
Step: 1 Unlock

Question Has Been Solved by an Expert!
Get step-by-step solutions from verified subject matter experts
Step: 2 Unlock
Step: 3 Unlock