

Question: Q 5 ( 1 0 points ) The purchasing - power value figures for the minimum wage ( in $ ' s ) for the
Q points
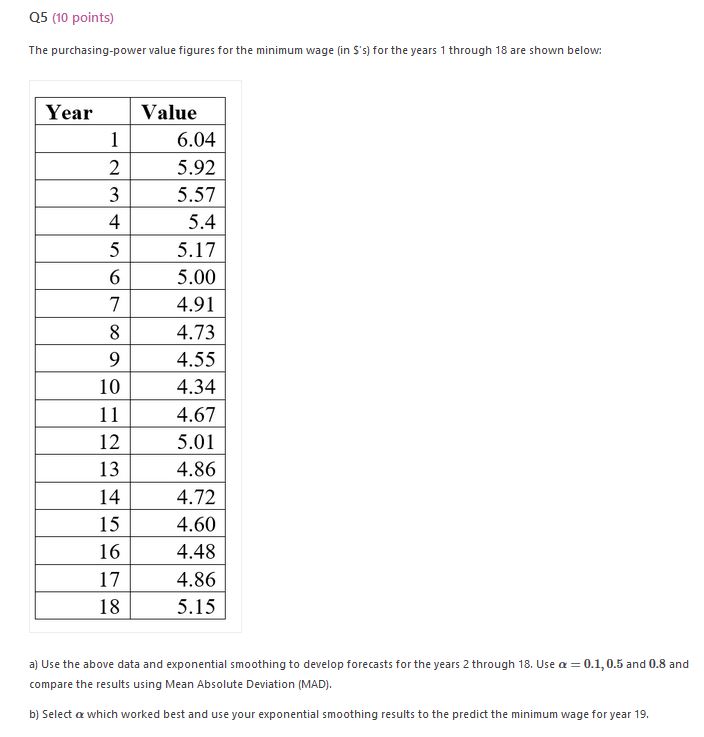
The purchasingpower value figures for the minimum wage in $s for the years through are shown below:
a Use the above data and exponential smoothing to develop forecasts for the years through Use and and
compare the results using Mean Absolute Deviation MAD
b Select which worked best and use your exponential smoothing results to the predict the minimum wage for year
Step by Step Solution
There are 3 Steps involved in it
1 Expert Approved Answer
Step: 1 Unlock

Question Has Been Solved by an Expert!
Get step-by-step solutions from verified subject matter experts
Step: 2 Unlock
Step: 3 Unlock