

Question: Q . 5 . ( 5 pts ) The graph shows the tensile load - strain response of the specimen shown in the figure below.
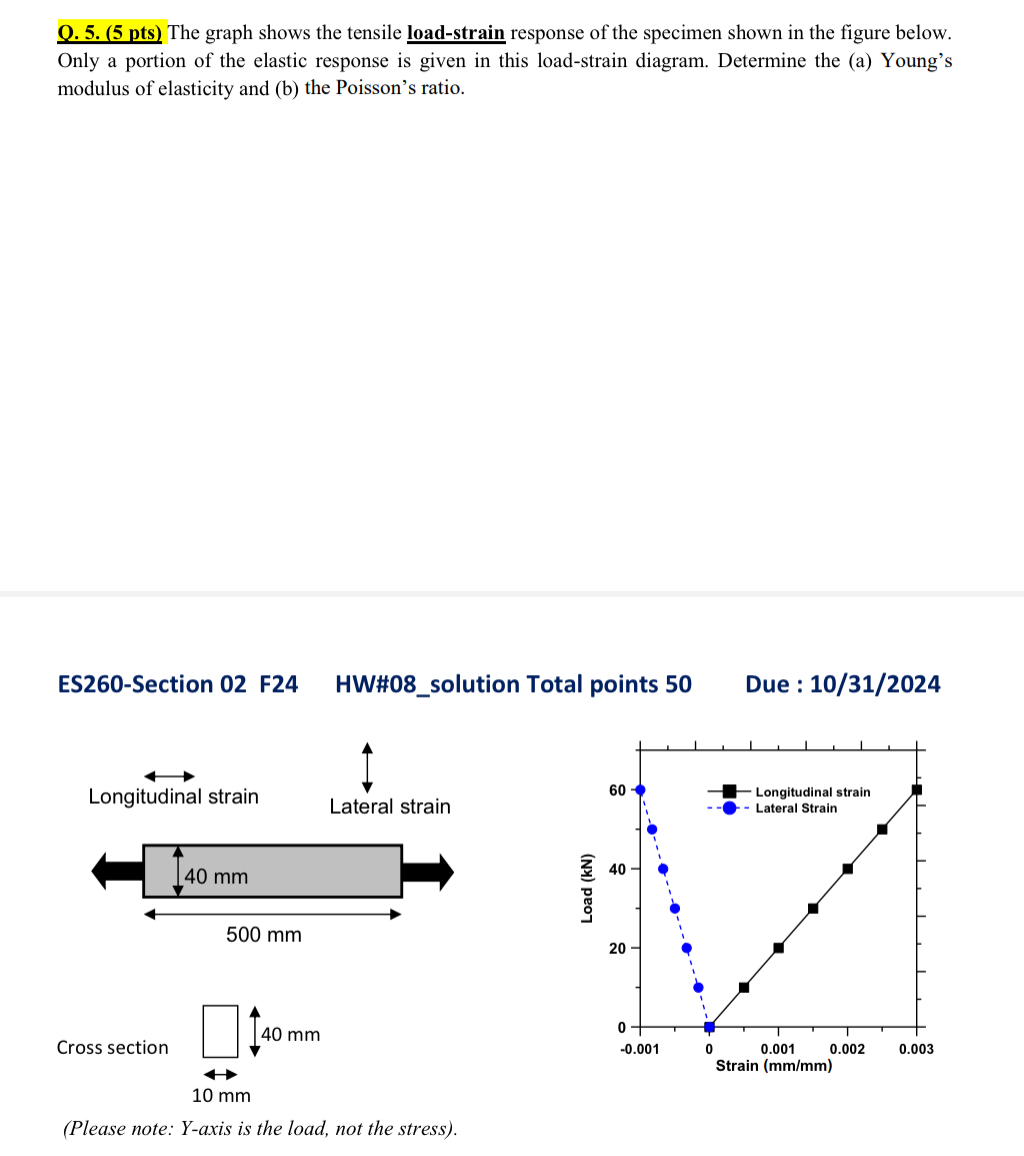
Q pts The graph shows the tensile loadstrain response of the specimen shown in the figure below. Only a portion of the elastic response is given in this loadstrain diagram. Determine the a Young's modulus of elasticity and b the Poisson's ratio.
ESSection F HW#solution Total points Due:
Cross section
Please note: Yaxis is the load, not the stress
Step by Step Solution
There are 3 Steps involved in it
1 Expert Approved Answer
Step: 1 Unlock

Question Has Been Solved by an Expert!
Get step-by-step solutions from verified subject matter experts
Step: 2 Unlock
Step: 3 Unlock