

Question: Q 5 / Statistics and Probability Consider the set of sample data below. a. Compute the mean and standard deviation for these sample data. b.
Q 5 / Statistics and Probability
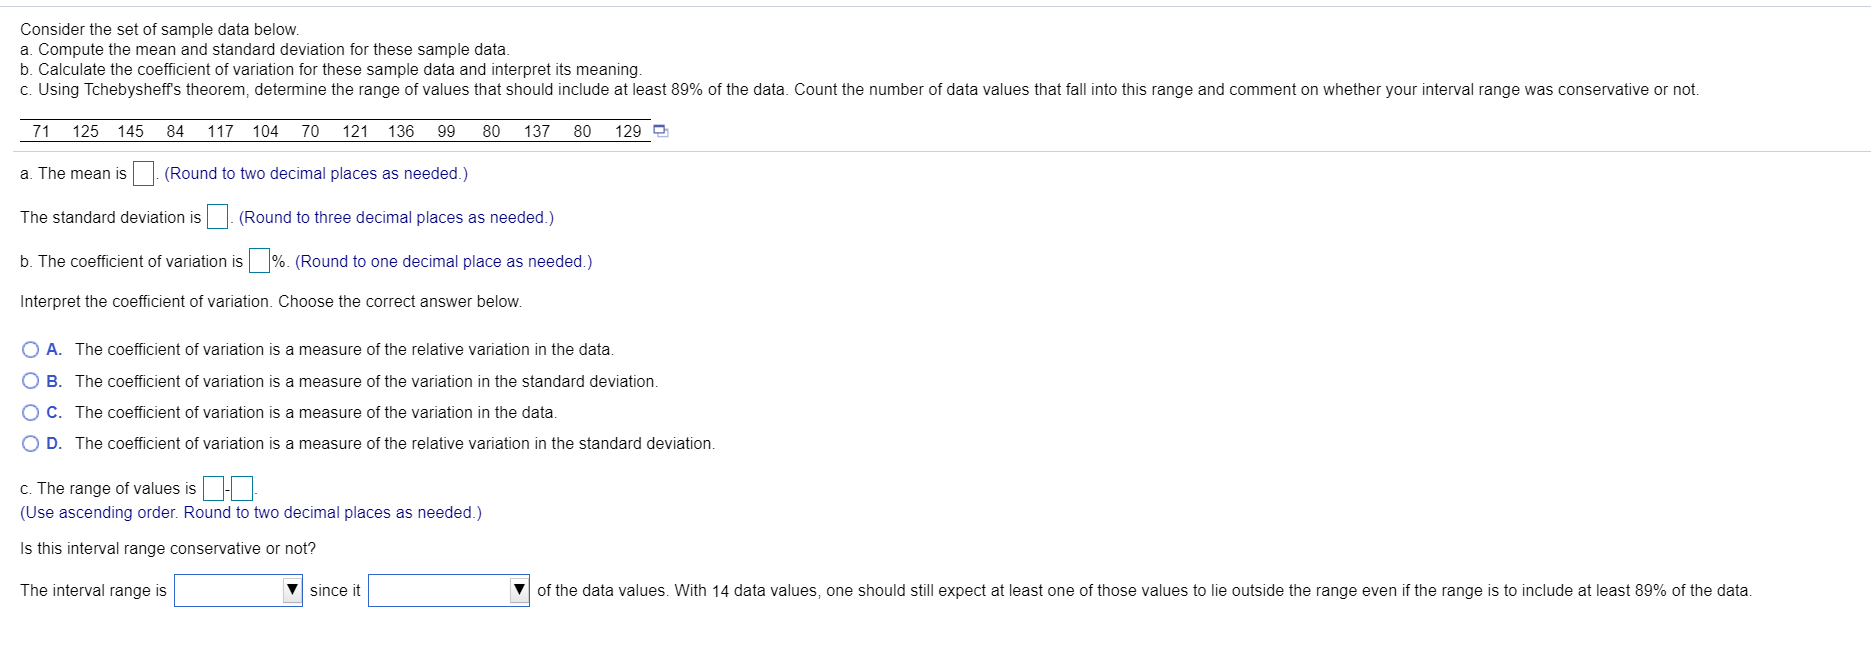
Consider the set of sample data below. a. Compute the mean and standard deviation for these sample data. b. Calculate the coefficient of variation for these sample data and interpret its meaning. c. Using Tchebysheff's theorem, determine the range of values that should include at least 89% of the data. Count the number of data values that fall into this range and comment on whether your interval range was conservative or not. 71 125 145 84 117 70 121 136 99 80 137 80 129 a. The mean is . (Round to two decimal places as needed.) The standard deviation is . (Round to three decimal places as needed.) b. The coefficient of variation is %. (Round to one decimal place as needed.) Interpret the coefficient of variation. Choose the correct answer below. O A. The coefficient of variation is a measure of the relative variation in the data. O B. The coefficient of variation is a measure of the variation in the standard deviation. O C. The coefficient of variation is a measure of the variation in the data O D. The coefficient of variation is a measure of the relative variation in the standard deviation. c. The range of values is- (Use ascending order. Round to two decimal places as needed.) Is this interval range conservative or not? The interval range is since it of the data values. With 14 data values, one should still expect at least one of those values to lie outside the range even if the range is to include at least 89% of the data
Step by Step Solution
There are 3 Steps involved in it

Get step-by-step solutions from verified subject matter experts