

Question: Q. How can Murarka find out if the new process were meeting the target defect proportion? Find Cp and Cpk with excel (show working) and
Q. How can Murarka find out if the new process were meeting the target defect proportion? Find Cp and Cpk with excel (show working) and also show the graph. Is the process within design specifications?
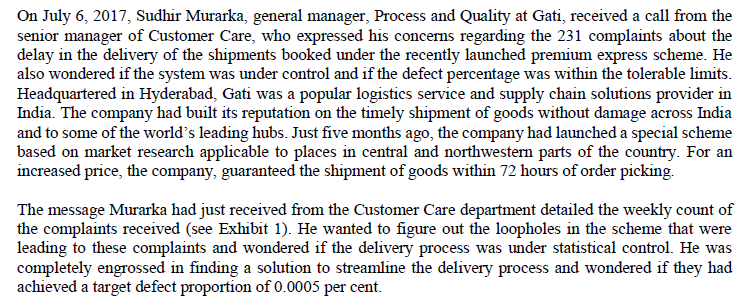
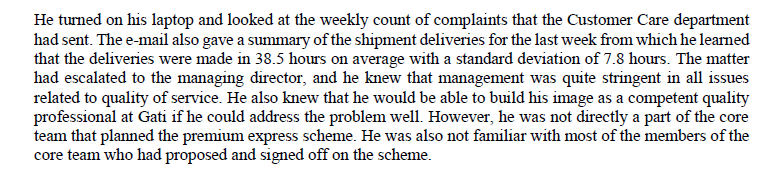
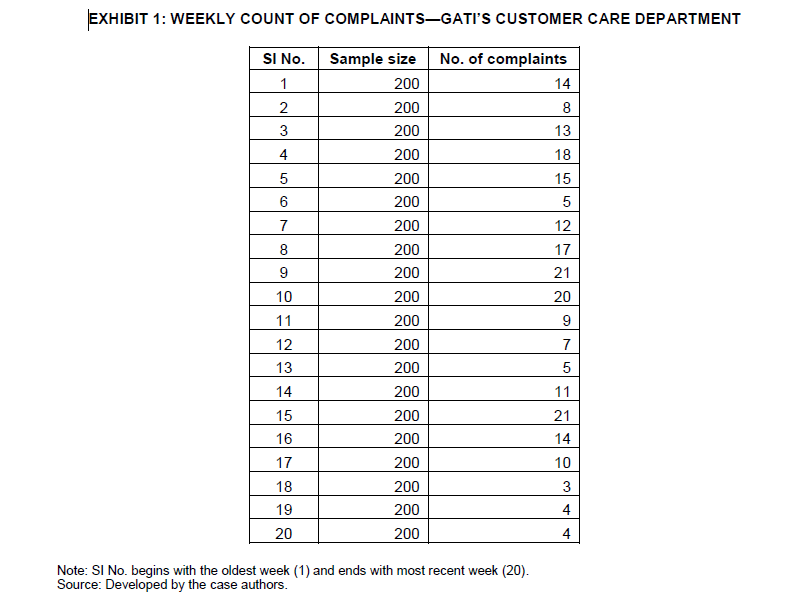
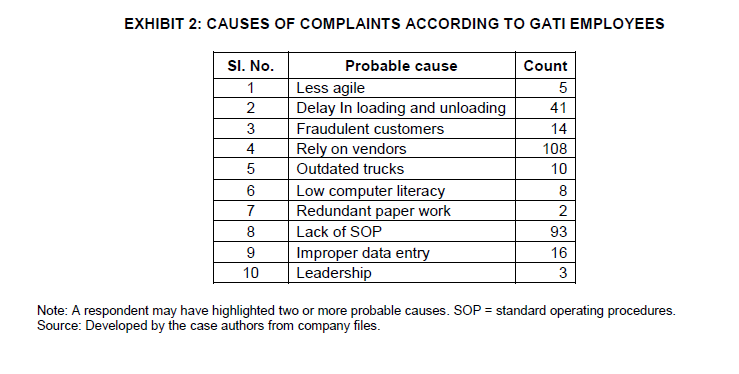
On July 6, 2017, Sudhir Murarka, general manager, Process and Quality at Gati, received a call from the senior manager of Customer Care, who expressed his concerns regarding the 231 complaints about the delay in the delivery of the shipments booked under the recently launched premium express scheme. He also wondered if the system was under control and if the defect percentage was within the tolerable limits. Headquartered in Hyderabad, Gati was a popular logistics service and supply chain solutions provider in India. The company had built its reputation on the timely shipment of goods without damage across India and to some of the world's leading hubs. Just five months ago, the company had launched a special scheme based on market research applicable to places in central and northwestem parts of the country. For an increased price, the company, guaranteed the shipment of goods within 72 hours of order picking. The message Murarka had just received from the Customer Care department detailed the weekly count of the complaints received (see Exhibit 1). He wanted to figure out the loopholes in the scheme that were leading to these complaints and wondered if the delivery process was under statistical control. He was completely engrossed in finding a solution to streamline the delivery process and wondered if they had achieved a target defect proportion of 0.0005 per cent. He turned on his laptop and looked at the weekly count of complaints that the Customer Care department had sent. The e-mail also gave a summary of the shipment deliveries for the last week from which he learned that the deliveries were made in 38.5 hours on average with a standard deviation of 7.8 hours. The matter had escalated to the managing director, and he knew that management was quite stringent in all issues related to quality of service. He also knew that he would be able to build his image as a competent quality professional at Gati if he could address the problem well. However, he was not directly a part of the core team that planned the premium express scheme. He was also not familiar with most of the members of the core team who had proposed and signed off on the scheme. EXHIBIT 1: WEEKLY COUNT OF COMPLAINTSGATI'S CUSTOMER CARE DEPARTMENT SI No. No. of complaints 1 Sample size 200 200 14 2 8 3 200 13 4 200 18 5 200 15 6 200 5 7 200 12 8 200 17 9 200 21 10 200 20 11 200 9 12 200 7 13 200 5 14 200 11 15 200 21 16 200 14 17 200 10 18 200 3 19 200 4 20 200 4 Note: SI No. begins with the oldest week (1) and ends with most recent week (20). Source: Developed by the case authors. EXHIBIT 2: CAUSES OF COMPLAINTS ACCORDING TO GATI EMPLOYEES SI. No. Count 1 5 2 Probable cause Less agile Delay In loading and unloading Fraudulent customers Rely on vendors 41 3 14 4 108 5 Outdated trucks 10 6 8 7 2 8 Low computer literacy Redundant paper work Lack of SOP Improper data entry Leadership 93 9 16 10 3 Note: A respondent may have highlighted two or more probable causes. SOP = standard operating procedures. Source: Developed by the case authors from company files
Step by Step Solution
There are 3 Steps involved in it
1 Expert Approved Answer
Step: 1 Unlock

Question Has Been Solved by an Expert!
Get step-by-step solutions from verified subject matter experts
Step: 2 Unlock
Step: 3 Unlock