

Question: Q.) How would I do work capital current ratio and quick ratio? Table 1Balance Sheets begin{tabular}{lll|l|l} hline 2018 & 2019 & 2020 & 2021
Q.) How would I do work capital current ratio and quick ratio?
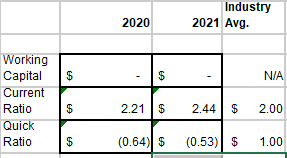
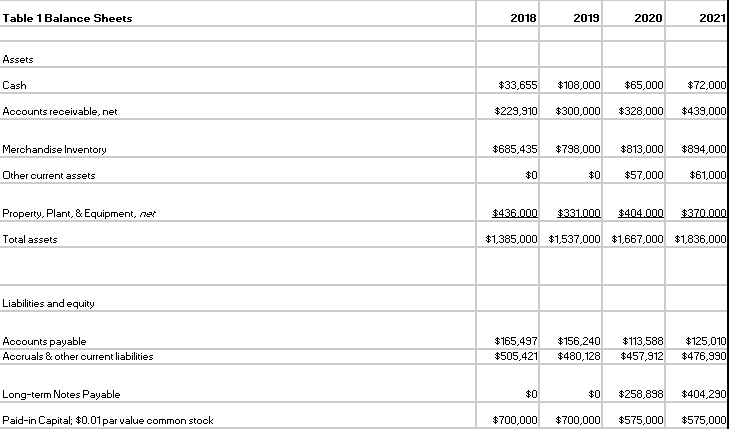
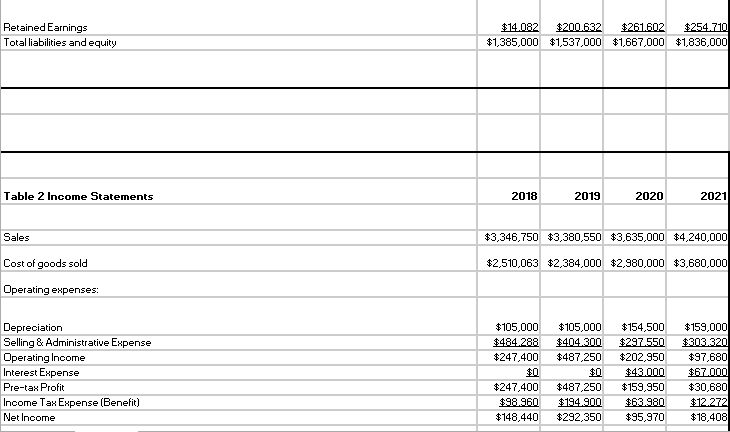
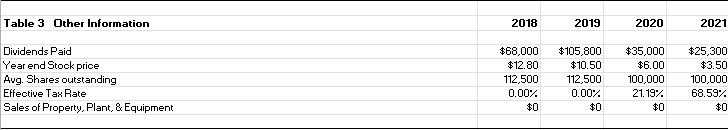
Table 1Balance Sheets \begin{tabular}{lll|l|l} \hline 2018 & 2019 & 2020 & 2021 \\ \hline \end{tabular} Assets Cash Accounts receivable, net \begin{tabular}{|r|r|r|r|} $33,655 & $108,000 & $65,000 & $72,000 \\ \hline$229,910 & $300,000 & $328,000 & $439,000 \\ \hline & & & \\ \hline$685,435 & $798,000 & $813,000 & $894,000 \\ \hline$0 & $0 & $57,000 & $61,000 \\ \hline \end{tabular} Property. Plant, \& Equipment, ner $436.000$331000$404.000$370.000 Total assets $1,385,000$1,537,000$1,667,000$1,836,000 Liabilities and equity Acoounts payable Acoruals & other current liabilities \begin{tabular}{|l|l|l|r|r|} $165,497 & $156,240 & $113,586 & $125,010 \\ \hline$505,421 & $480,128 & $457,912 & $476,990 \\ \hline \end{tabular} Long-term Notes Payable $0 $0$258,898$404,290 Paid-in Capital; \$0.01par value common stock $700,000$700,000$575,000$575,000 Retained Earnings Total liabilities and equity \begin{tabular}{rrrrr} $14,082 & $200,632 & $261,602 & $254,710 \\ \hline$1,385,000 & $1,537,000 & $1,667,000 & $1,836,000 \end{tabular} Table 2 Income Statements Sales $3,346,750$3,380,550$3,635,000$4,240,000 Cost of goods sold $2,510,063$2,384,000$2,980,000$3,680,000 Dperatingenpenses: Depreciation Selling 8 dministrative Expense Dperating lncome Interest Expense Pre-tan Profit Income Tax Expense (Benefit) Net lncome \begin{tabular}{r|r|r|r|} \hline$105,000 & $105,000 & $154,500 & $159,000 \\ \hline$484,288 & $404,300 & $297550 & $303,320 \\ \hline$247,400 & $487,250 & $202,950 & $97,680 \\ \hline$100 & $0 & $43,000 & $67,000 \\ \hline$247,400 & $487,250 & $159,950 & $30,680 \\ \hline$98,960 & $194,900 & $63.980 & $12,272 \\ \hline$148,440 & $292,350 & $95,970 & $18,408 \\ \hline \end{tabular} Table 3 Other Information \begin{tabular}{|l|l|l|l|} \hline 2018 & 2019 & 2020 & 2021 \\ \hline \end{tabular} Dividends Paid Year end Stook price Avg. Shares outstanding Effective Tas Rate Sales of Property, Plant, \& Equipment Sales of Property, Plank, Q. Equipment \begin{tabular}{|r|r|r|r|} \hline$68,000 & $105,800 & $35,000 & $25,300 \\ \hline$12.80 & $10.50 & $6.00 & $3.50 \\ \hline 112,500 & 112,500 & 100,000 & 100,000 \\ \hline 0.00% & 0.00% & 21.19% & 68.59% \\ \hline$0 & $0 & $0 & $0 \\ \hline \end{tabular}
Step by Step Solution
There are 3 Steps involved in it

Get step-by-step solutions from verified subject matter experts