

Question: Q. I just need help with the question #7. 6) You investigate the relationship between height and dbh (diameter at breast height) of oak trees.
Q. I just need help with the question #7.
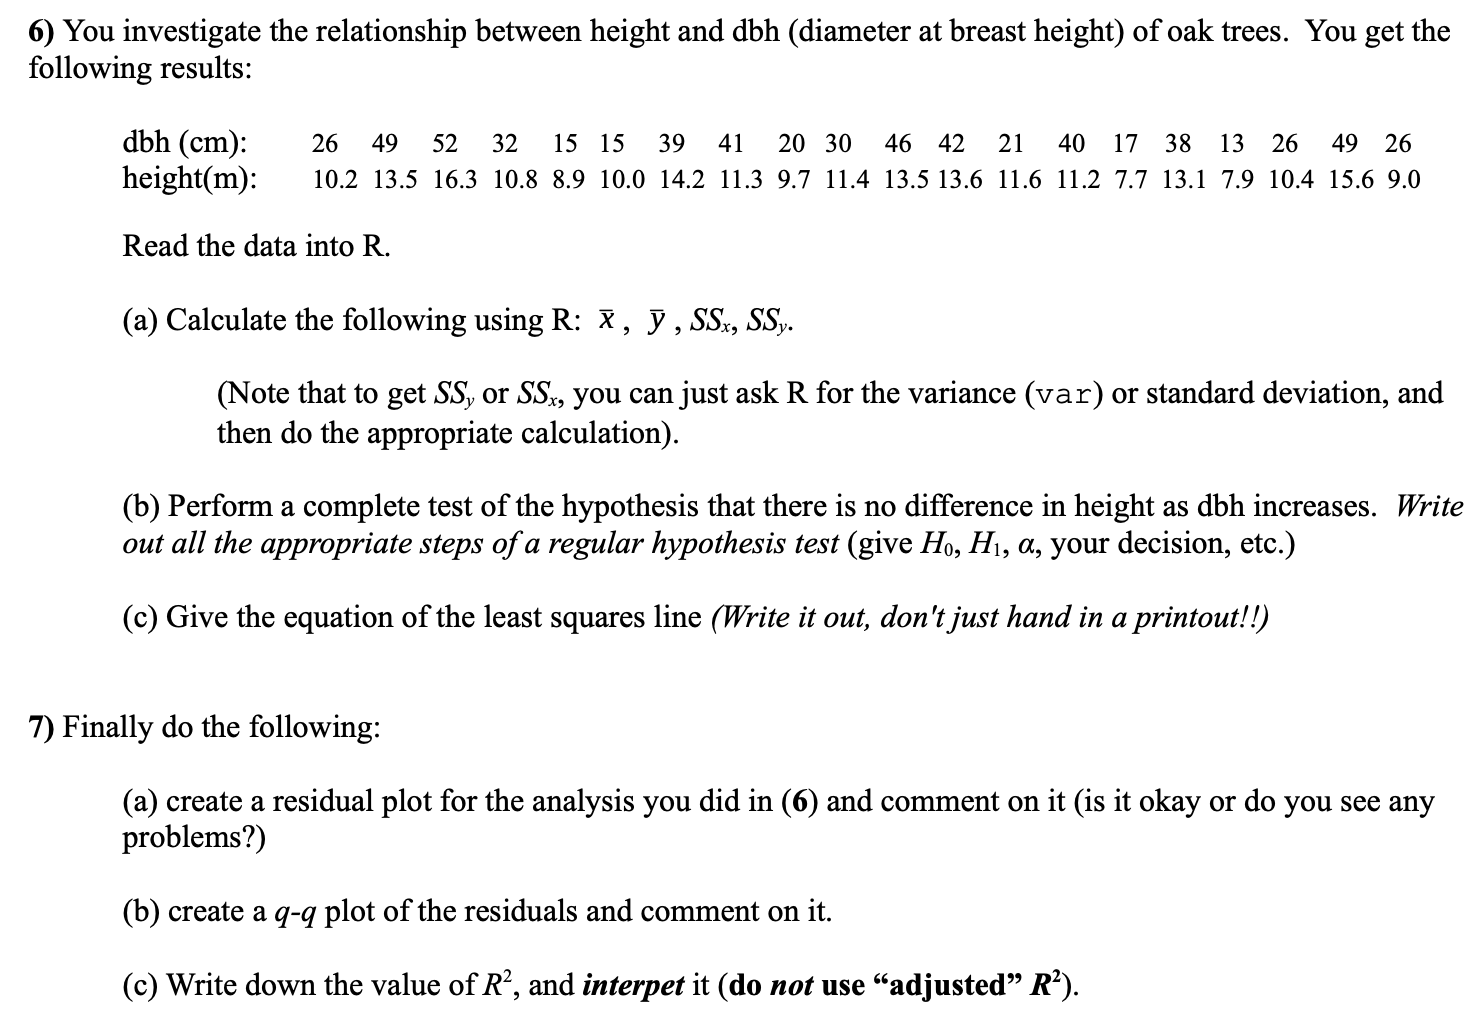
6) You investigate the relationship between height and dbh (diameter at breast height) of oak trees. You get the following results: dbh(cm): 26 49 52 32 1515 39 41 20 30 46 42 21 40 17 38 13 26 49 26 height(m): 10.2 13.5 16.3 10.8 8.9 10.0 14.2 11.3 9.7 11.4 13513.6 11.6 11.2 7.7 13.1 7.9 10.4 15.6 9.0 Read the data into R (a) Calculate the following using R: X , )7 , SSx, SSy. (Note that to get SSy or SSx, you can just ask R for the variance (var) or stande deviation, and then do the appropriate calculation). (b) Perform a complete test of the hypothesis that there is no difference in height as dbh increases. Write out all the appropriate steps of a regular hypothesis test (give H0, H1, 01, your decision, etc.) (0) Give the equation of the least squares line (Write it out. don 't just hand in a printout! !) 7) Finally do the following: (a) create a residual plot for the analysis you did in (6) and comment on it (is it okay or do you see any problems?) (b) create a q-q plot of the residuals and comment on it. (c) Write down the value of R2, and interpret it (do not use \"adjusted\" R2)
Step by Step Solution
There are 3 Steps involved in it

Get step-by-step solutions from verified subject matter experts