

Question: Q Search Do: Chapter 15 End-of-Chapter Problems 6. Gravetter/Wallnau/Forzano, - Chapter 15 - End-of-chapter question S For the following scores, X Y 3 6 5
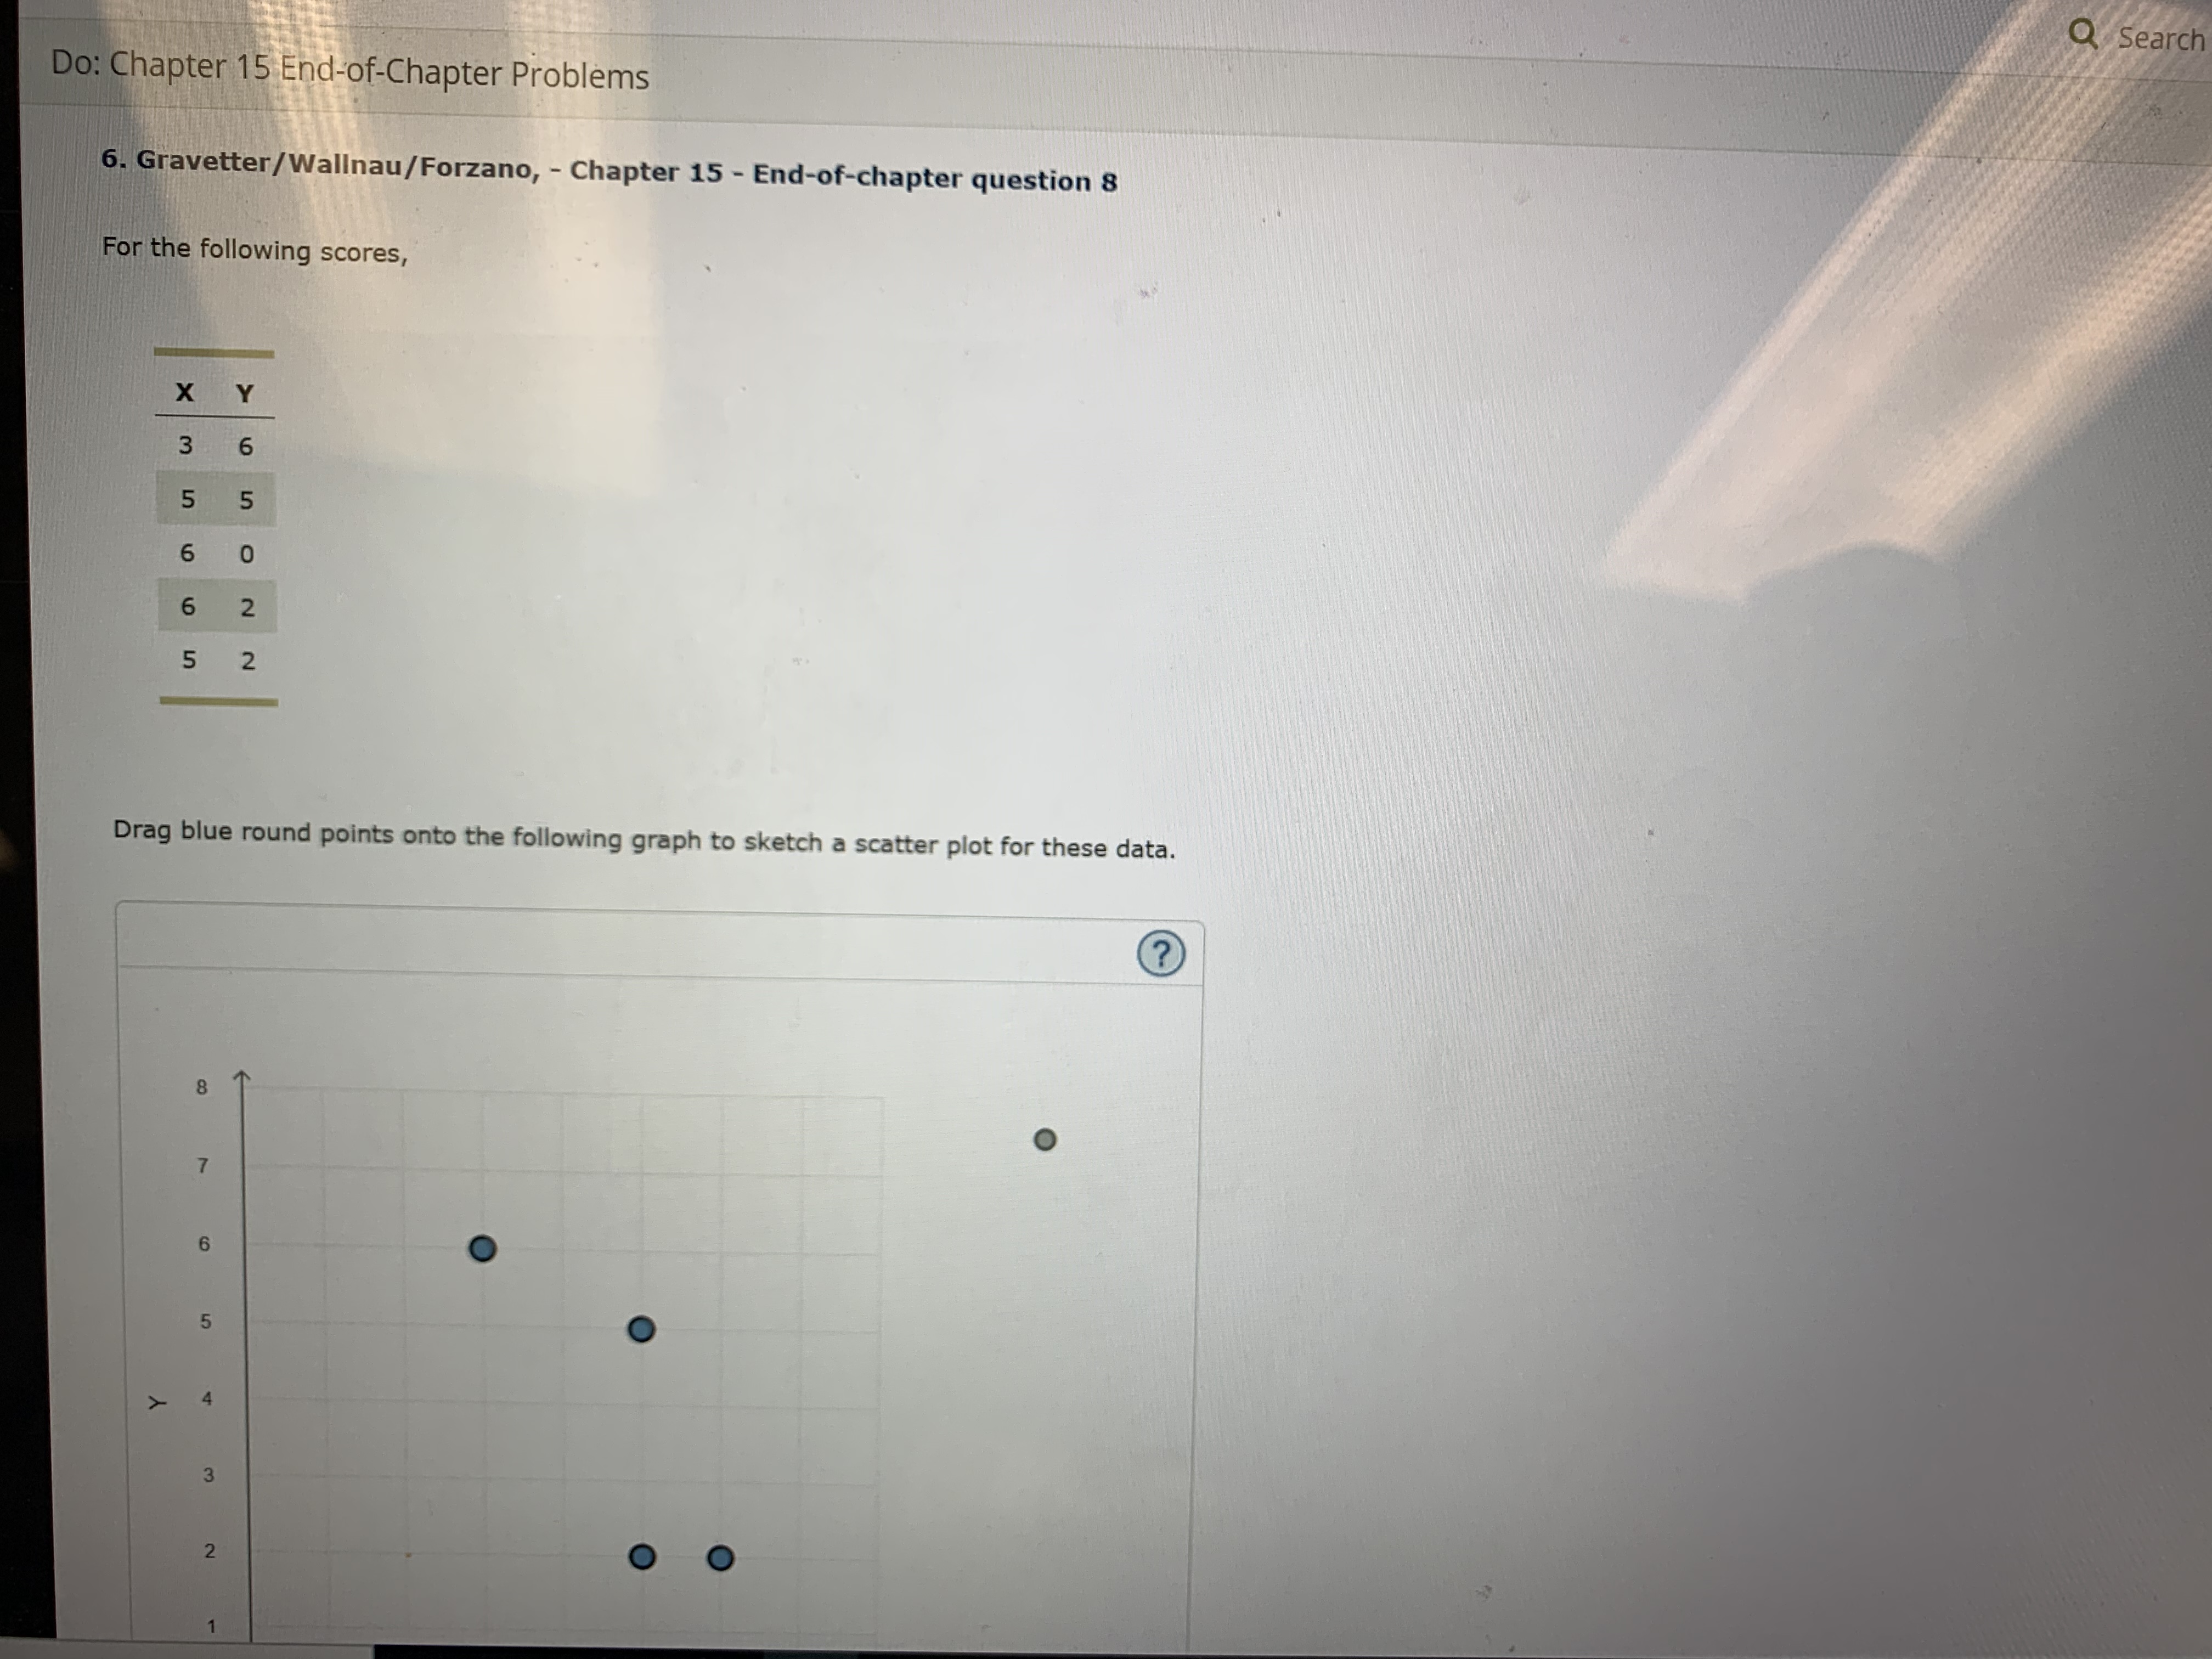
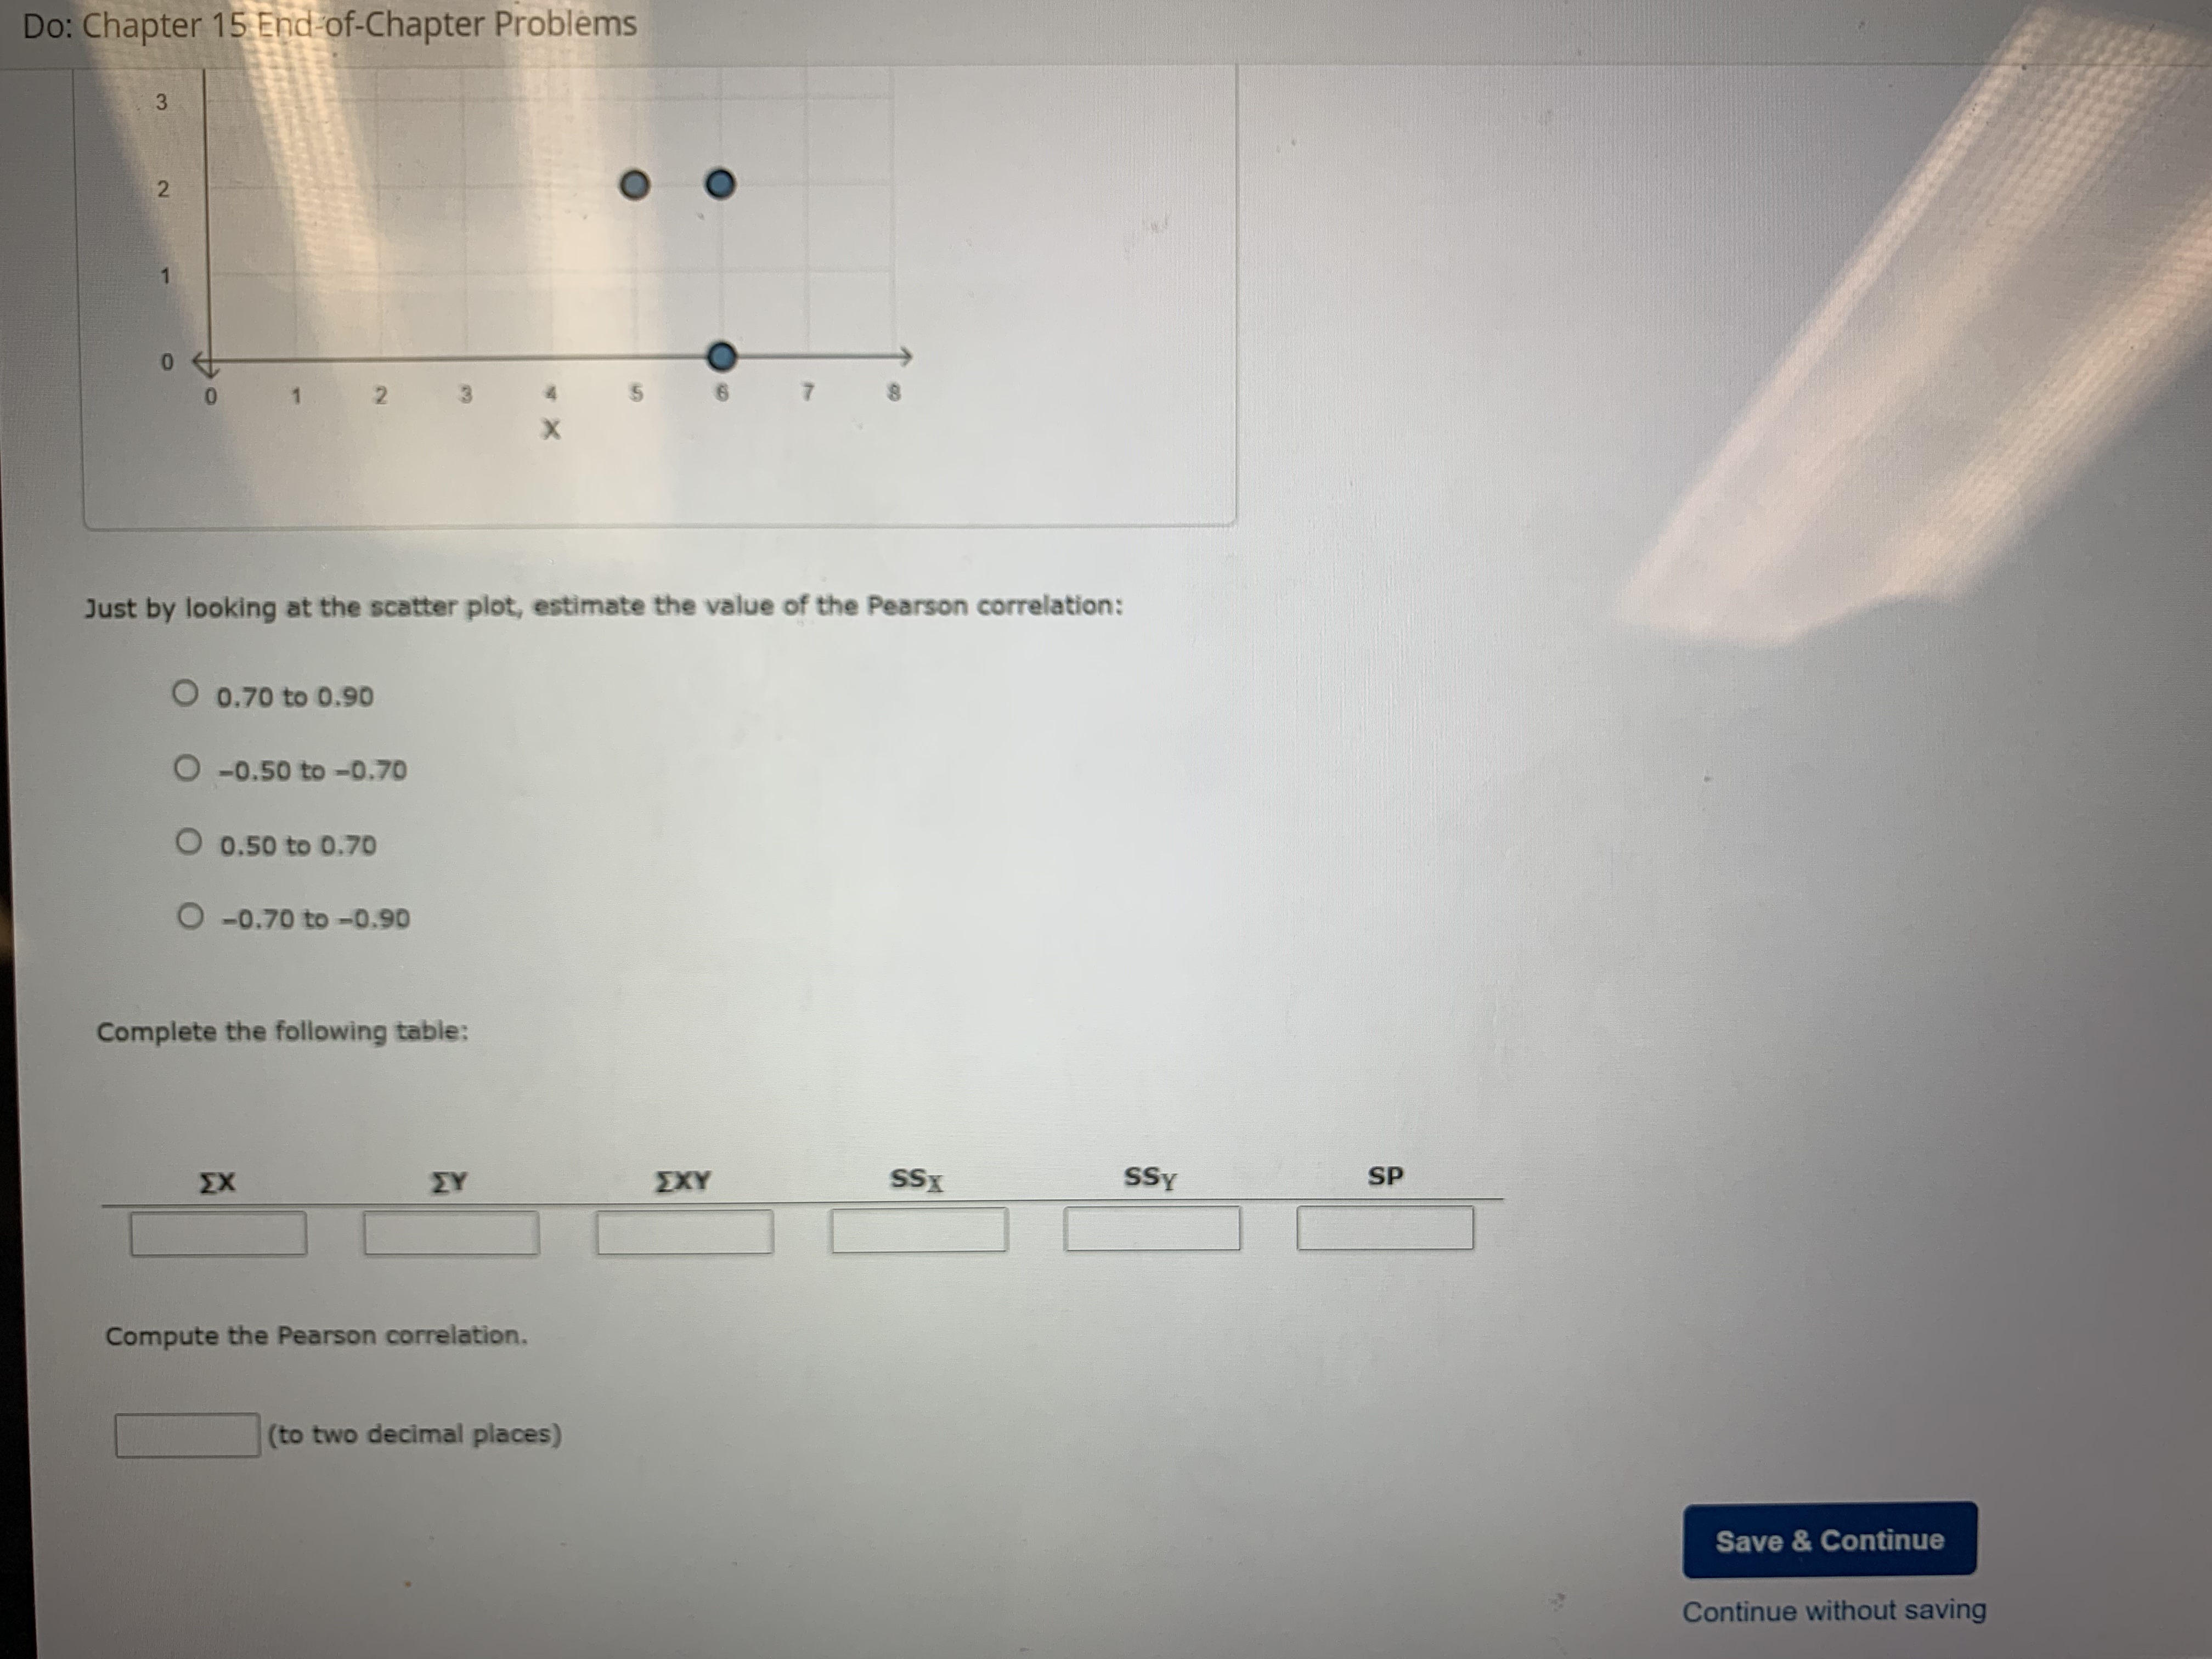
Q Search Do: Chapter 15 End-of-Chapter Problems 6. Gravetter/Wallnau/Forzano, - Chapter 15 - End-of-chapter question S For the following scores, X Y 3 6 5 5 0 2 5 2 Drag blue round points onto the following graph to sketch a scatter plot for these data. (?) O 5 3 2 ODo: Chapter 15 End of-Chapter Problems 5 6 Just by looking at the scatter plot, estimate the value of the Pearson correlation: O 0.70 to 0.90 O -0.50 to -0.70 O 0.50 to 0.70 O -0.70 to -0.90 Complete the following table: EX EXY SSX SSY SP Compute the Pearson correlation. (to two decimal places) Save & Continue Continue without saving
Step by Step Solution
There are 3 Steps involved in it
1 Expert Approved Answer
Step: 1 Unlock

Question Has Been Solved by an Expert!
Get step-by-step solutions from verified subject matter experts
Step: 2 Unlock
Step: 3 Unlock