

Question: Q) Write a Matlab code to generate exactly the figure below with the following properties: O Number of points used for plot is 80 Linewidth
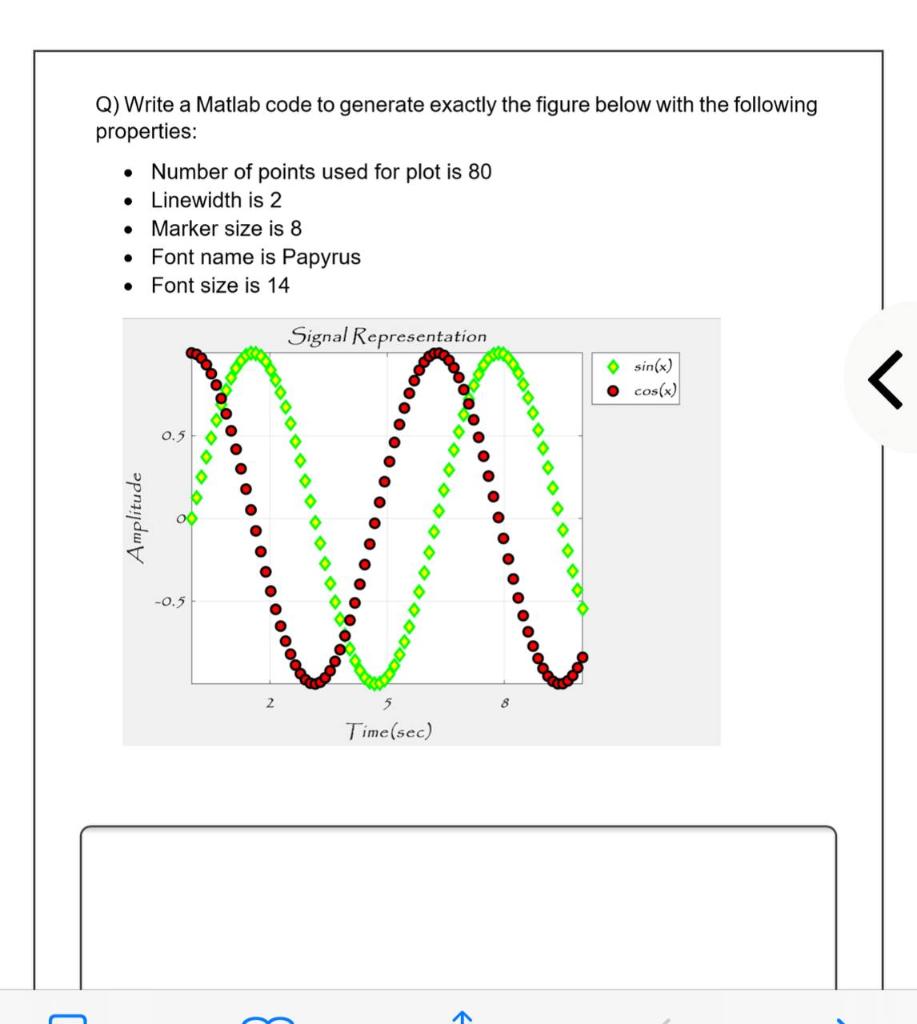
Q) Write a Matlab code to generate exactly the figure below with the following properties: O Number of points used for plot is 80 Linewidth is 2 Marker size is 8 Font name is Papyrus Font size is 14 . Signal Representation sin(x) cos(x)
Step by Step Solution
There are 3 Steps involved in it
1 Expert Approved Answer
Step: 1 Unlock

Question Has Been Solved by an Expert!
Get step-by-step solutions from verified subject matter experts
Step: 2 Unlock
Step: 3 Unlock