

Question: Q1) (10 Points) The annual returns for the US Equity market from 1900-2000 are captured below. These returns are also available in an Excel spreadsheet
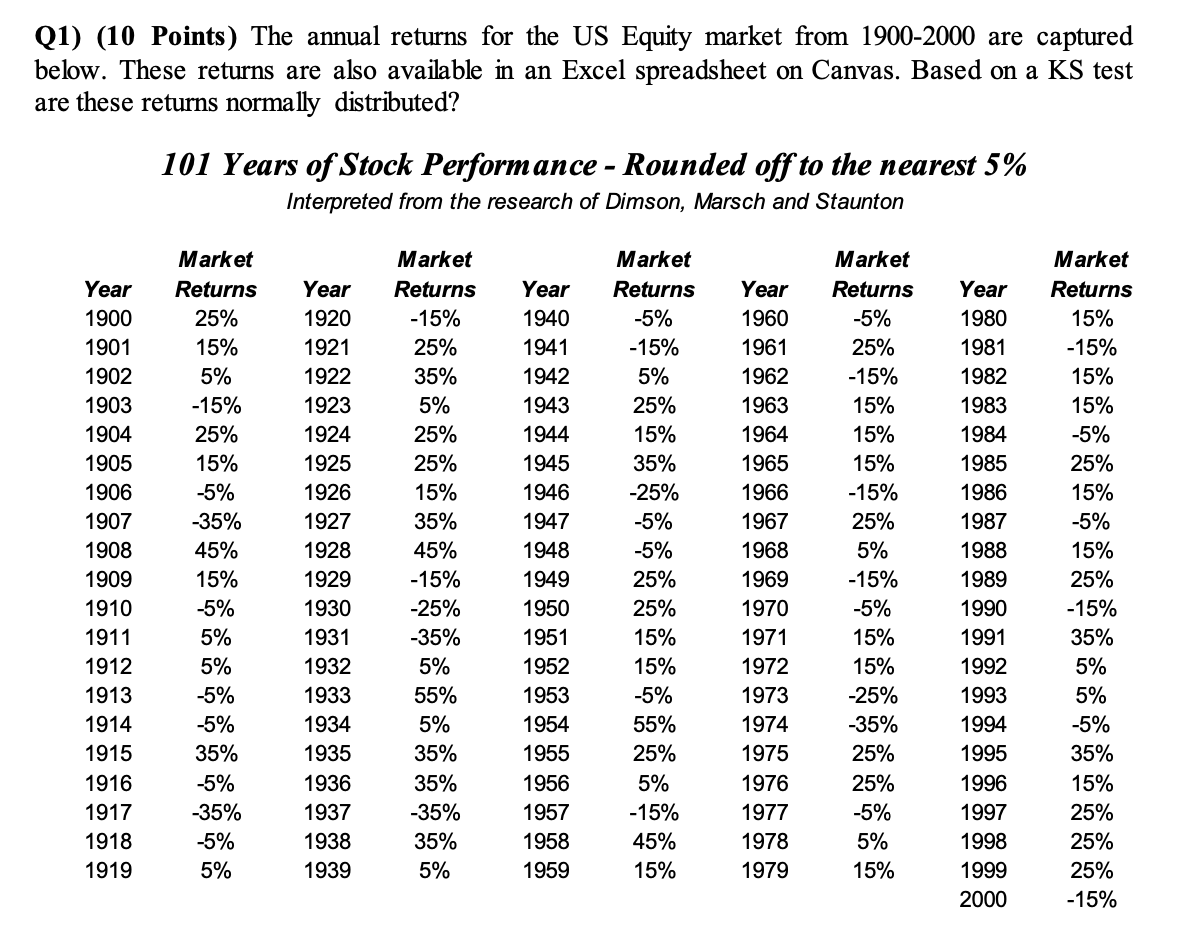
Q1) (10 Points) The annual returns for the US Equity market from 1900-2000 are captured below. These returns are also available in an Excel spreadsheet on Canvas. Based on a KS test are these returns normally distributed? 101 Years of Stock Performance - Rounded off to the nearest 5% Interpreted from the research of Dimson, Marsch and Staunton Market Returns -5% -15% 5% Year 1900 1901 1902 1903 1904 1905 1906 1907 1908 1909 1910 1911 1912 1913 1914 1915 1916 1917 1918 1919 Market Returns 25% 15% 5% -15% 25% 15% -5% -35% 45% 15% -5% 5% 5% -5% -5% 35% -5% -35% -5% 5% Year 1920 1921 1922 1923 1924 1925 1926 1927 1928 1929 1930 1931 1932 1933 1934 1935 1936 1937 1938 1939 Market Returns -15% 25% 35% 5% 25% 25% 15% 35% 45% -15% -25% -35% 5% 55% 5% 35% 35% -35% 35% 5% Year 1940 1941 1942 1943 1944 1945 1946 1947 1948 1949 1950 1951 1952 1953 1954 1955 1956 1957 1958 1959 25% 15% 35% -25% -5% -5% 25% 25% 15% 15% -5% 55% 25% 5% -15% 45% 15% Year 1960 1961 1962 1963 1964 1965 1966 1967 1968 1969 1970 1971 1972 1973 1974 1975 1976 1977 1978 1979 Market Returns -5% 25% -15% 15% 15% 15% -15% 25% 5% -15% -5% 15% 15% -25% -35% 25% 25% -5% 5% 15% Year 1980 1981 1982 1983 1984 1985 1986 1987 1988 1989 1990 1991 1992 1993 1994 1995 1996 1997 1998 1999 2000 Market Returns 15% -15% 15% 15% -5% 25% 15% -5% 15% 25% -15% 35% 5% 5% -5% 35% 15% 25% 25% 25% -15%
Step by Step Solution
There are 3 Steps involved in it

Get step-by-step solutions from verified subject matter experts