

Question: Q1 (b) - each graph needs to be approximately half page in size. All the axis need to be labeled. The TU values need to
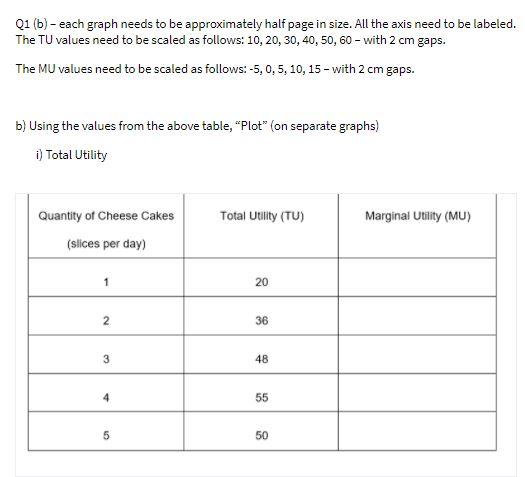
Q1 (b) - each graph needs to be approximately half page in size. All the axis need to be labeled. The TU values need to be scaled as follows: 10, 20, 30, 40, 50, 60 - with 2 cm gaps. The MU values need to be scaled as follows: -5, 0, 5, 10, 15 - with 2 cm gaps. b) Using the values from the above table, "Plot" (on separate graphs) i) Total Utility Total Utility (TU) Marginal Utility (MU) Quantity of Cheese Cakes (slices per day) 20 2 36 3 48 4 55 5 50
Step by Step Solution
There are 3 Steps involved in it
1 Expert Approved Answer
Step: 1 Unlock

Question Has Been Solved by an Expert!
Get step-by-step solutions from verified subject matter experts
Step: 2 Unlock
Step: 3 Unlock