

Question: Q1 (b) The table below shows data on risky assets for a World universe for the past 10 years. Assume the global benchmark World risk-free
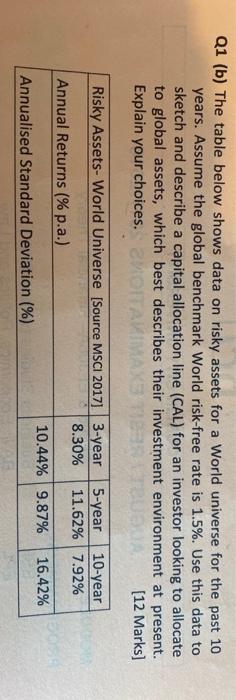
Q1 (b) The table below shows data on risky assets for a World universe for the past 10 years. Assume the global benchmark World risk-free rate is 1.5%. Use this data to sketch and describe a capital allocation line (CAL) for an investor looking to allocate to global assets, which best describes their investment environment at present. Explain your choices. MONTAVIMAS [12 Marks) Risky Assets-World Universe Source MSCI 2017] 3-year 5-year 10-year 8.30% 11.62% 7.92% Annual Returns (% p.a.) 10.44% 9.87% 16.42% Annualised Standard Deviation (%) Q1 (b) The table below shows data on risky assets for a World universe for the past 10 years. Assume the global benchmark World risk-free rate is 1.5%. Use this data to sketch and describe a capital allocation line (CAL) for an investor looking to allocate to global assets, which best describes their investment environment at present. Explain your choices. MONTAVIMAS [12 Marks) Risky Assets-World Universe Source MSCI 2017] 3-year 5-year 10-year 8.30% 11.62% 7.92% Annual Returns (% p.a.) 10.44% 9.87% 16.42% Annualised Standard Deviation (%)
Step by Step Solution
There are 3 Steps involved in it

Get step-by-step solutions from verified subject matter experts