

Question: Q1 Below is a project cash flow forecasting worksheet that you will use to perform some sensitivity and scenario analysis. We did NOT formally do
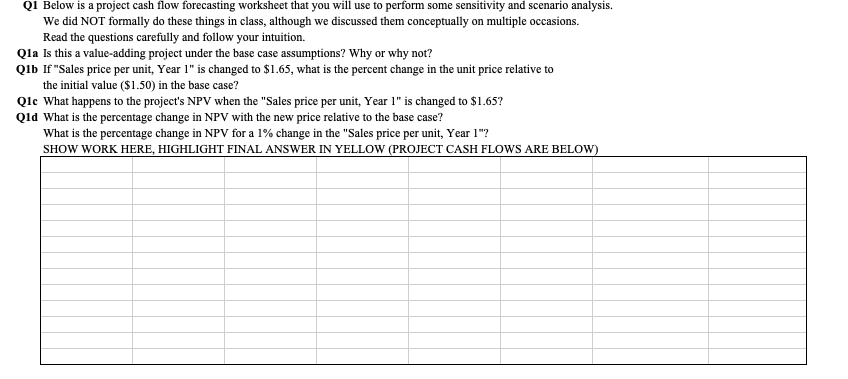
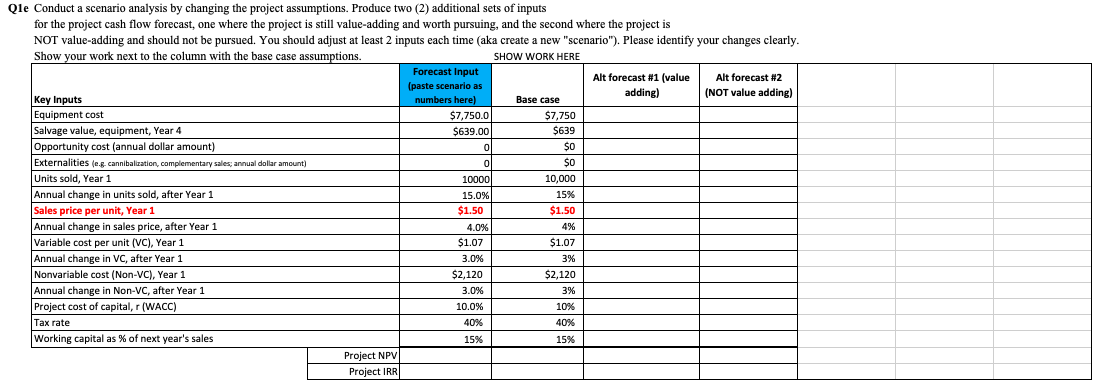
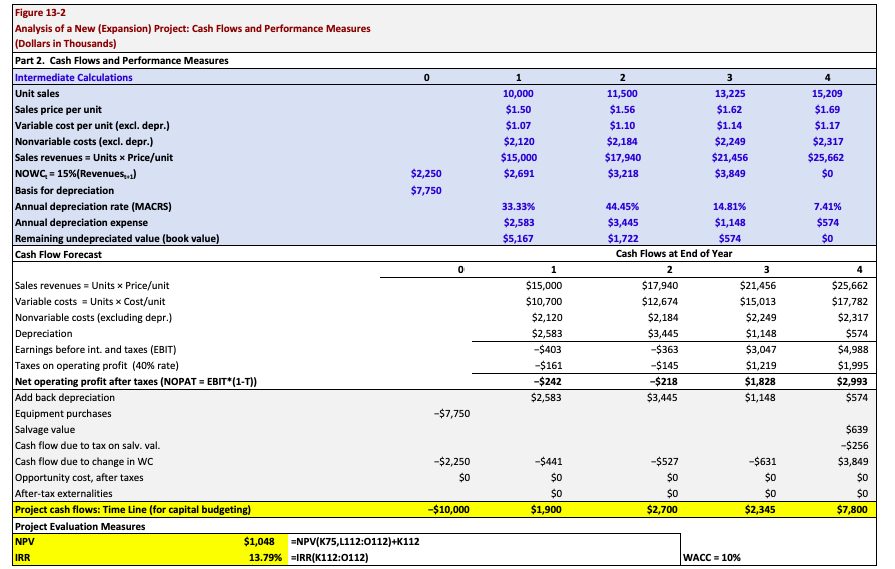
Q1 Below is a project cash flow forecasting worksheet that you will use to perform some sensitivity and scenario analysis. We did NOT formally do these things in class, although we discussed them conceptually on multiple occasions. Read the questions carefully and follow your intuition. Qla Is this a value-adding project under the base case assumptions? Why or why not? Qlb If "Sales price per unit, Year 1" is changed to $1.65, what is the percent change in the unit price relative to the initial value ($1.50) in the base case? Qlc What happens to the project's NPV when the "Sales price per unit, Year 1" is changed to $1.65? Qld What is the percentage change in NPV with the new price relative to the base case? What is the percentage change in NPV for a 1% change in the "Sales price per unit, Year 1"? SHOW WORK HERE, HIGHLIGHT FINAL ANSWER IN YELLOW (PROJECT CASH FLOWS ARE BELOW) 0 0 Qle Conduct a scenario analysis by changing the project assumptions. Produce two (2) additional sets of inputs for the project cash flow forecast, one where the project is still value-adding and worth pursuing, and the second where the project is NOT value-adding and should not be pursued. You should adjust at least 2 inputs each time (aka create a new "scenario"). Please identify your changes clearly. Show your work next to the column with the base case assumptions. SHOW WORK HERE Forecast Input Alt forecast #1 (value Alt forecast #2 (paste scenario as Key Inputs adding) (NOT value adding) numbers here) Base case Equipment cost $7,750.0 $7,750 Salvage value, equipment, Year 4 $639,000 $639 Lotus Opportunity cost (annual dollar amount) $0 But Externalities (e.g. cannibalization, complementary sales; annual dollar amount) huw $0 Units sold, Year 1 10000 10 10,000 Annual change in units sold, after Year 1 Bu yer 15.0% 15% Sales price per unit, Year 1 $1.50 $1.50 Annual change in sales price, after Year 1 4.0% 4% Variable cost per unit (VC), Year 1 (1 +42 4 $1.07 $1.07 . Annual change in Vc, after Year 1 3.0% 3% Nonvariable cost (Non-VC), Year 1 $2,120 $2,120 Annual change in Non-VC, after Year 1 3.0% 3% Project cost of capital, r(WACC) 10.0% 10% Tax rate 40% 40% Working capital as % of next year's sales 15% 15% Project NPV Project IRR 0 4 Figure 13-2 Analysis of a New (Expansion) Project: Cash Flows and Performance Measures (Dollars in Thousands) Part 2. Cash Flows and Performance Measures Intermediate Calculations Unit sales Sales price per unit Variable cost per unit (excl. depr.) Nonvariable costs (excl. depr.) Sales revenues = Units Price/unit NOWC = 15%(Revenues...) Basis for depreciation Annual depreciation rate (MACRS) Annual depreciation expense Remaining undepreciated value (book value) Cash Flow Forecast 1 10,000 $1.50 $1.07 $2,120 $15,000 $2,691 2 11,500 $1.56 $1.10 $2,184 $17,940 $3,218 3 13,225 $1.62 $1.14 $2,249 $21,456 $3,849 15,209 $1.69 $1.17 $2,317 $25,662 $0 $2,250 $7,750 7.41% 33.33% $2,583 $5,167 $574 $0 1 4 $15,000 $10,700 $2,120 $2,583 -$403 $161 -$242 $2,583 44.45% 14.81% $3,445 $1,148 $1,722 $574 Cash Flows at End of Year 2 3 $17,940 $21,456 $12,674 $15,013 $2,184 $2,249 $3,445 $1,148 -$363 $3,047 $145 $1,219 -$218 $1,828 $3,445 $1,148 $25,662 $17,782 $2,317 $574 $4,988 $1,995 $2,993 $574 -$7,750 Sales revenues = Units Price/unit Variable costs - Units X Cost/unit Nonvariable costs (excluding depr.) Depreciation Earnings before int and taxes (EBIT) Taxes on operating profit (40% rate) Net operating profit after taxes (NOPAT = EBIT*(1-T)) Add back depreciation Equipment purchases Salvage value Cash flow due to tax on salv. val. Cash flow due to change in WC Opportunity cost, after taxes After-tax externalities Project cash flows: Time Line (for capital budgeting) Project Evaluation Measures NPV $1,048 =NPV(K75,L112:0112)+K112 IRR 13.79% =IRR(K112:0112) -$2,250 $0 -$527 -$441 $0 $0 $1,900 -$527 $0 $0 $2,700 $631 $0 $0 $2,345 $639 -$256 $3,849 $0 $0 $7,800 -$10,000 WACC = 10% Q1 Below is a project cash flow forecasting worksheet that you will use to perform some sensitivity and scenario analysis. We did NOT formally do these things in class, although we discussed them conceptually on multiple occasions. Read the questions carefully and follow your intuition. Qla Is this a value-adding project under the base case assumptions? Why or why not? Qlb If "Sales price per unit, Year 1" is changed to $1.65, what is the percent change in the unit price relative to the initial value ($1.50) in the base case? Qlc What happens to the project's NPV when the "Sales price per unit, Year 1" is changed to $1.65? Qld What is the percentage change in NPV with the new price relative to the base case? What is the percentage change in NPV for a 1% change in the "Sales price per unit, Year 1"? SHOW WORK HERE, HIGHLIGHT FINAL ANSWER IN YELLOW (PROJECT CASH FLOWS ARE BELOW) 0 0 Qle Conduct a scenario analysis by changing the project assumptions. Produce two (2) additional sets of inputs for the project cash flow forecast, one where the project is still value-adding and worth pursuing, and the second where the project is NOT value-adding and should not be pursued. You should adjust at least 2 inputs each time (aka create a new "scenario"). Please identify your changes clearly. Show your work next to the column with the base case assumptions. SHOW WORK HERE Forecast Input Alt forecast #1 (value Alt forecast #2 (paste scenario as Key Inputs adding) (NOT value adding) numbers here) Base case Equipment cost $7,750.0 $7,750 Salvage value, equipment, Year 4 $639,000 $639 Lotus Opportunity cost (annual dollar amount) $0 But Externalities (e.g. cannibalization, complementary sales; annual dollar amount) huw $0 Units sold, Year 1 10000 10 10,000 Annual change in units sold, after Year 1 Bu yer 15.0% 15% Sales price per unit, Year 1 $1.50 $1.50 Annual change in sales price, after Year 1 4.0% 4% Variable cost per unit (VC), Year 1 (1 +42 4 $1.07 $1.07 . Annual change in Vc, after Year 1 3.0% 3% Nonvariable cost (Non-VC), Year 1 $2,120 $2,120 Annual change in Non-VC, after Year 1 3.0% 3% Project cost of capital, r(WACC) 10.0% 10% Tax rate 40% 40% Working capital as % of next year's sales 15% 15% Project NPV Project IRR 0 4 Figure 13-2 Analysis of a New (Expansion) Project: Cash Flows and Performance Measures (Dollars in Thousands) Part 2. Cash Flows and Performance Measures Intermediate Calculations Unit sales Sales price per unit Variable cost per unit (excl. depr.) Nonvariable costs (excl. depr.) Sales revenues = Units Price/unit NOWC = 15%(Revenues...) Basis for depreciation Annual depreciation rate (MACRS) Annual depreciation expense Remaining undepreciated value (book value) Cash Flow Forecast 1 10,000 $1.50 $1.07 $2,120 $15,000 $2,691 2 11,500 $1.56 $1.10 $2,184 $17,940 $3,218 3 13,225 $1.62 $1.14 $2,249 $21,456 $3,849 15,209 $1.69 $1.17 $2,317 $25,662 $0 $2,250 $7,750 7.41% 33.33% $2,583 $5,167 $574 $0 1 4 $15,000 $10,700 $2,120 $2,583 -$403 $161 -$242 $2,583 44.45% 14.81% $3,445 $1,148 $1,722 $574 Cash Flows at End of Year 2 3 $17,940 $21,456 $12,674 $15,013 $2,184 $2,249 $3,445 $1,148 -$363 $3,047 $145 $1,219 -$218 $1,828 $3,445 $1,148 $25,662 $17,782 $2,317 $574 $4,988 $1,995 $2,993 $574 -$7,750 Sales revenues = Units Price/unit Variable costs - Units X Cost/unit Nonvariable costs (excluding depr.) Depreciation Earnings before int and taxes (EBIT) Taxes on operating profit (40% rate) Net operating profit after taxes (NOPAT = EBIT*(1-T)) Add back depreciation Equipment purchases Salvage value Cash flow due to tax on salv. val. Cash flow due to change in WC Opportunity cost, after taxes After-tax externalities Project cash flows: Time Line (for capital budgeting) Project Evaluation Measures NPV $1,048 =NPV(K75,L112:0112)+K112 IRR 13.79% =IRR(K112:0112) -$2,250 $0 -$527 -$441 $0 $0 $1,900 -$527 $0 $0 $2,700 $631 $0 $0 $2,345 $639 -$256 $3,849 $0 $0 $7,800 -$10,000 WACC = 10%
Step by Step Solution
There are 3 Steps involved in it

Get step-by-step solutions from verified subject matter experts