

Question: Q1: By using mathlab, draw an image and apply the average filter for (A) area and mixed filter for (b) ones. A B Q2: Draw
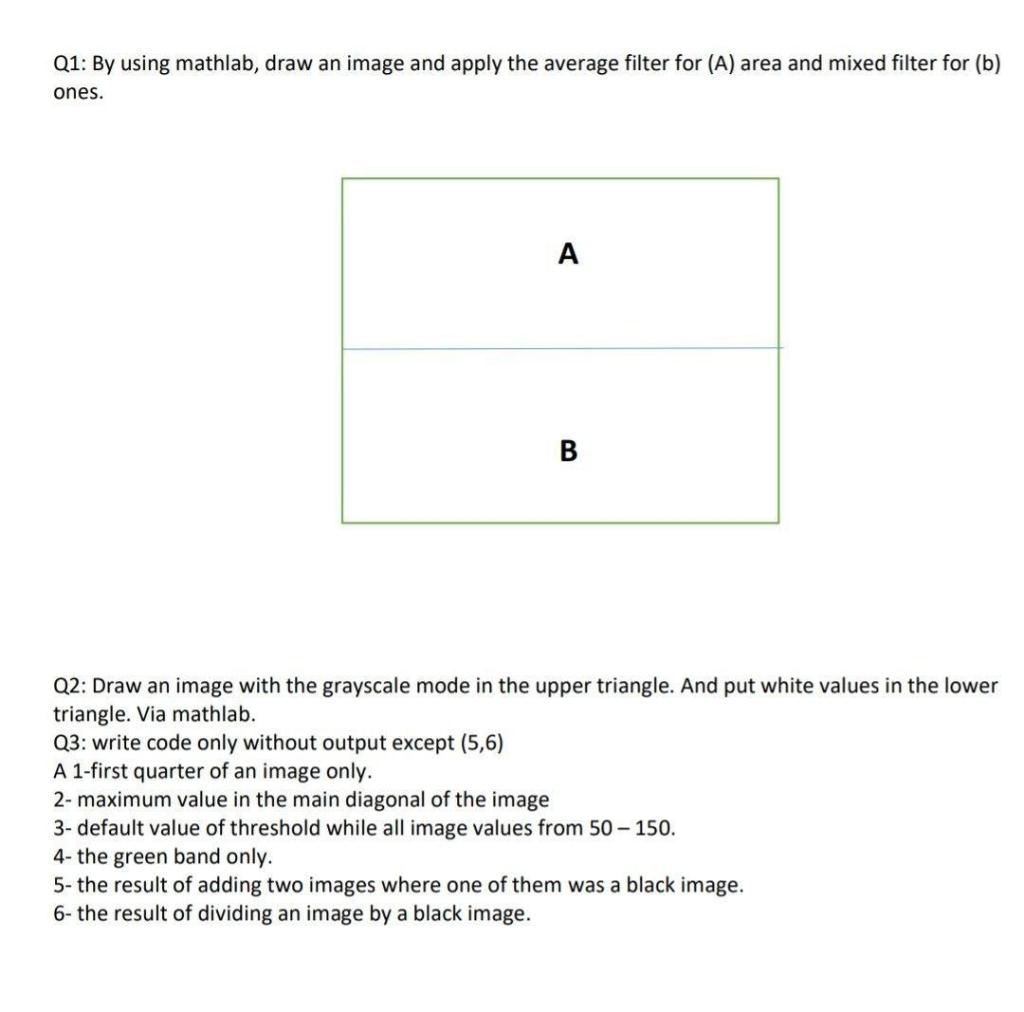
Q1: By using mathlab, draw an image and apply the average filter for (A) area and mixed filter for (b) ones. A B Q2: Draw an image with the grayscale mode in the upper triangle. And put white values in the lower triangle. Via mathlab. Q3: write code only without output except (5,6) A 1-first quarter of an image only. 2- maximum value in the main diagonal of the image 3- default value of threshold while all image values from 50 150. 4- the green band only. 5- the result of adding two images where one of them was a black image. 6- the result of dividing an image by a black image. Q1: By using mathlab, draw an image and apply the average filter for (A) area and mixed filter for (b) ones. A B Q2: Draw an image with the grayscale mode in the upper triangle. And put white values in the lower triangle. Via mathlab. Q3: write code only without output except (5,6) A 1-first quarter of an image only. 2- maximum value in the main diagonal of the image 3- default value of threshold while all image values from 50 150. 4- the green band only. 5- the result of adding two images where one of them was a black image. 6- the result of dividing an image by a black image
Step by Step Solution
There are 3 Steps involved in it

Get step-by-step solutions from verified subject matter experts