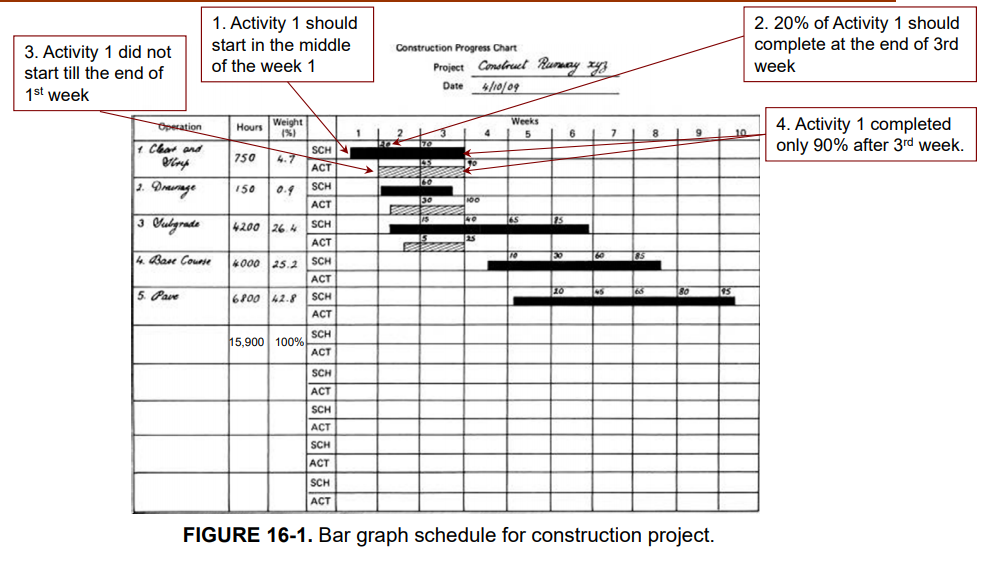
Question: Q1. Develop the bar chart on figure 16.1 yourself. You can use any tool/software that you like. It could be as simple as drawing it

Q1. Develop the bar chart on figure 16.1Q1. Develop the bar chart on figure 16.1

Q1. Develop the bar chart on figure 16.1 yourself. You can use any tool/software that you like. It could be as simple as drawing it in Excel, but I leave it up to you to select a tool of your choice. Hand-drawn bar charts will not be graded. (50 Points) 1. Activity 1 should start in the middle of the week 1 3. Activity 1 did not start till the end of 1st week Construction Progress Chart 2. 20% of Activity 1 should complete at the end of 3rd week Project Comelouet Rumay xyz Date 4/10/09 Houry Weight Weeks 5 %) 1 4 6 1 7 8 9 10 Operation 7 Cbar and lny 4. Activity 1 completed only 90% after 3rd week. 750 4.7 SCH ACT 990 2. Drainage JBE I Sulgrade 25 150 0.9 SCH ACT 4200 26.4 SCH ACT 4000 25.2 SCH ACT 16800 42.8 SCH ACT BE 4. Bare Course 120 10 5. Par 145 SCH 15,900 100% ACT SCH ACT SCH ACT SCH ACT SCH ACT FIGURE 16-1. Bar graph schedule for construction project

Step by Step Solution

There are 3 Steps involved in it

1 Expert Approved Answer
Step: 1 Unlock blur-text-image
Question Has Been Solved by an Expert!

Get step-by-step solutions from verified subject matter experts

Step: 2 Unlock
Step: 3 Unlock

Students Have Also Explored These Related General Management Questions!