

Question: Q1 Draw a graph The histogram has a longer left tail,has a longer right tail,appears roughly symmetric, so the distribution of the data is The
Q1 Draw a graph The histogram has a longer left tail,has a longer right tail,appears roughly symmetric, so the distribution of the data is
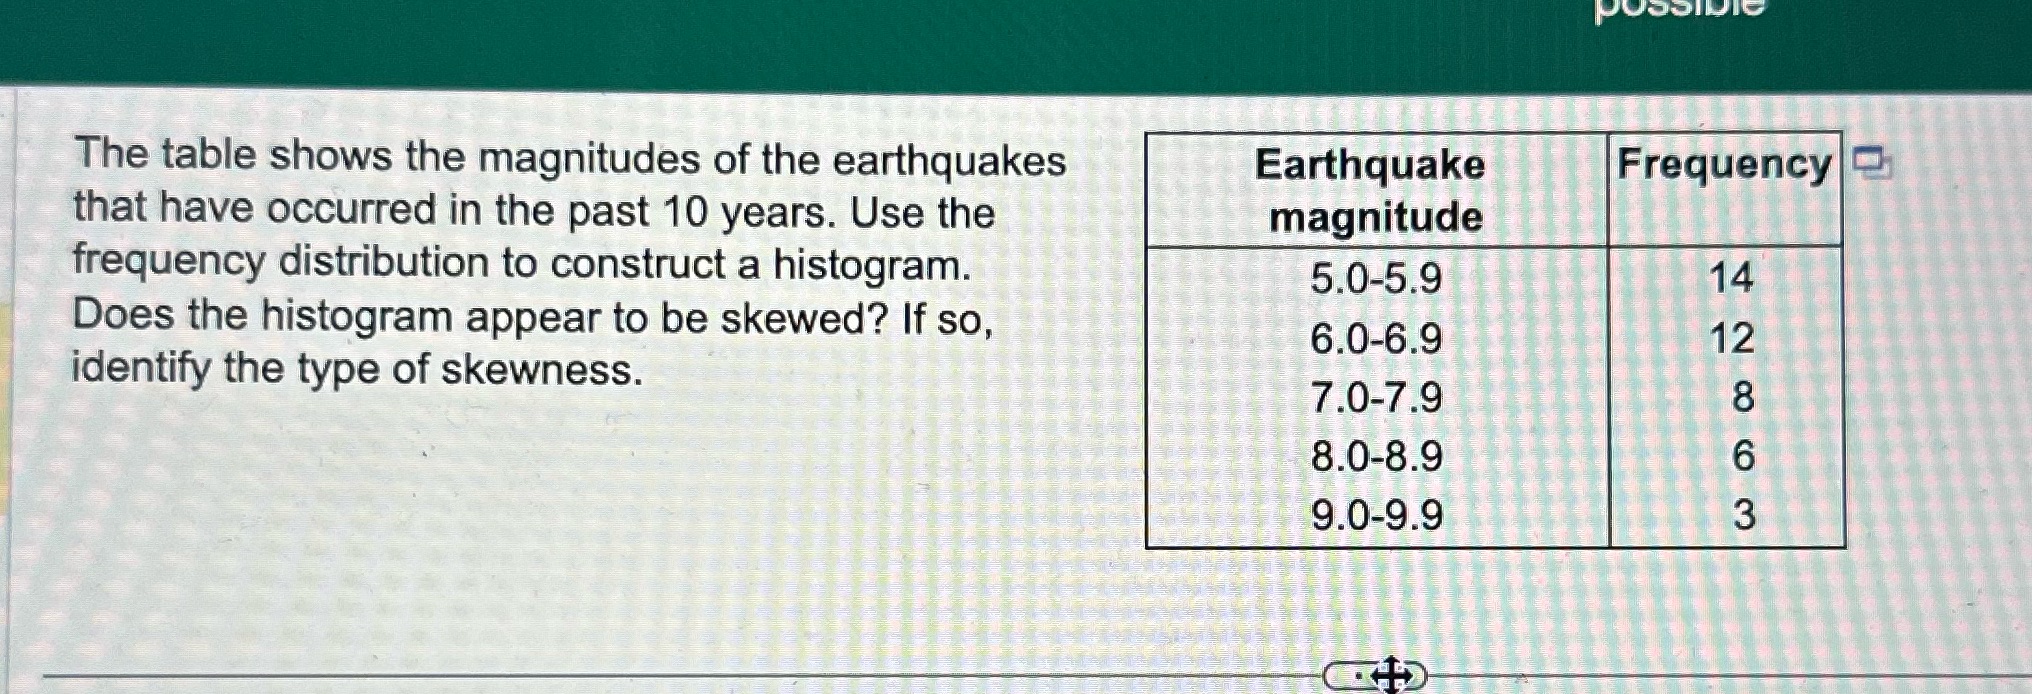
The table shows the magnitudes of the earthquakes Earthquake Frequency that have occurred in the past 10 years. Use the magnitude frequency distribution to construct a histogram. 5.0-5.9 14 Does the histogram appear to be skewed? If so, 6.0-6.9 identify the type of skewness. 7.0-7.9 WO OO N 8.0-8.9 9.0-9.9
Step by Step Solution
There are 3 Steps involved in it
1 Expert Approved Answer
Step: 1 Unlock

Question Has Been Solved by an Expert!
Get step-by-step solutions from verified subject matter experts
Step: 2 Unlock
Step: 3 Unlock