

Question: Q1. Explain the following diagram Q4. Construct an efficient portfolio from the following table with on two assets Bond Value Time Path of 10% Coupon
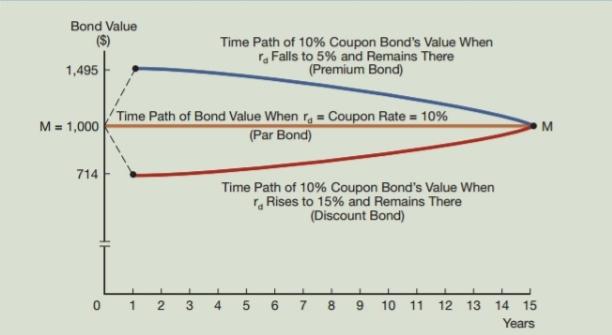
Q1. Explain the following diagram
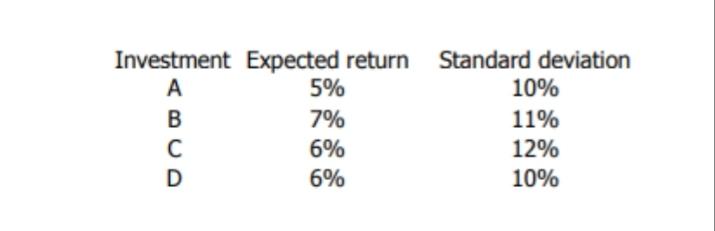
Q4. Construct an efficient portfolio from the following table with on two assets
Bond Value Time Path of 10% Coupon Bond's Value When r. Falls to 5% and Remains There (Premium Bond) 1,495 Time Path of Bond Value When r, = Coupon Rate = 10% (Par Bond) M = 1,000 M 714 Time Path of 10% Coupon Bond's Value When , Rises to 15% and Remains There (Discount Bond) 0 1 2 3 4 5 6 7 8 9 10 11 12 13 14 15 Years
Step by Step Solution
3.37 Rating (156 Votes )
There are 3 Steps involved in it
Q1 The diagram shows Bond prices as a function of term remaining until ... View full answer

Get step-by-step solutions from verified subject matter experts