

Question: Q.1 In the table below, you are given data on income distribution within the UK for the year 2012-2013. Population clumped together Percentage share of
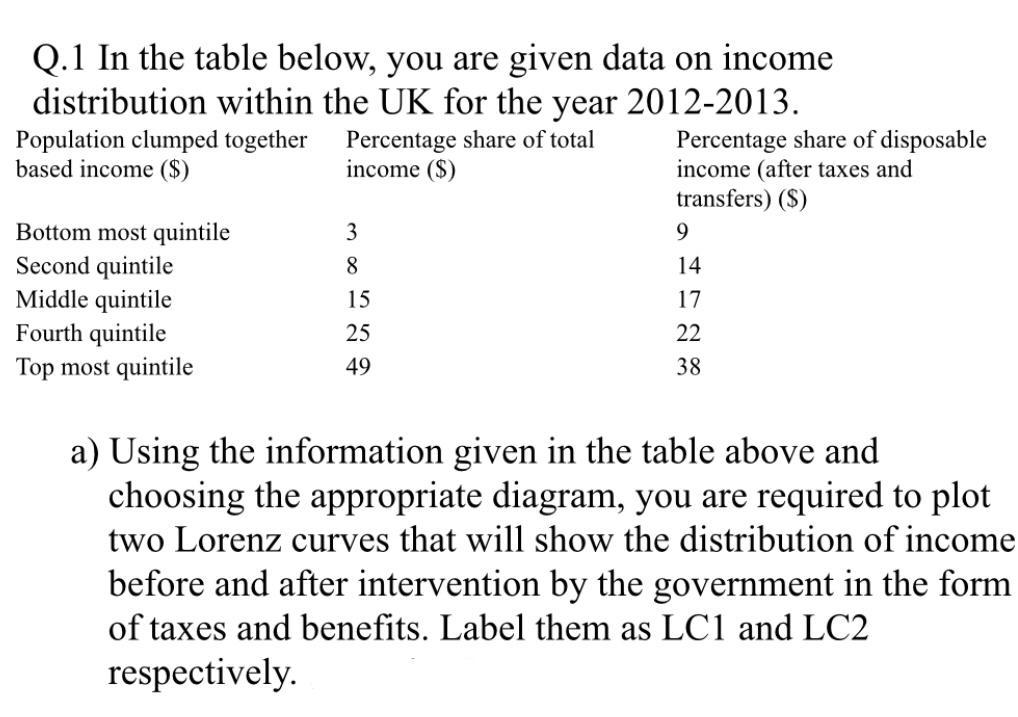
Q.1 In the table below, you are given data on income distribution within the UK for the year 2012-2013. Population clumped together Percentage share of total Percentage share of disposable based income ($) income ($) income (after taxes and transfers) ($) Bottom most quintile 3 Second quintile 8 14 Middle quintile 15 17 Fourth quintile 25 22 Top most quintile 49 38 9 a) Using the information given in the table above and choosing the appropriate diagram, you are required to plot two Lorenz curves that will show the distribution of income before and after intervention by the government in the form of taxes and benefits. Label them as LC1 and LC2 respectively
Step by Step Solution
There are 3 Steps involved in it

Get step-by-step solutions from verified subject matter experts