

Question: Q1. Indicate whether each of the following changes will increase or decrease the equilibrium price and quantity, or whether the effect cannot be predicted. Event


Q1.
Indicate whether each of the following changes will increase or decrease the equilibrium price and quantity, or whether the effect cannot be predicted.
Event | Equilibrium price | Equilibrium quantity |
| a. Demand increases; supply remains constant. | (circle the right one) Increase Cannot be predicted Decrease | (circle the right one) Decrease Increase Cannot be predicted |
| b. Supply increases; demand remains constant. | (circle the right one) Cannot be predicted Decrease Increase | (circle the right one) Cannot be predicted Decrease Increase |
| c. Demand decreases; supply remains constant. | (circle the right one) Increase Cannot be predicted Decrease | (circle the right one) Increase Decrease Cannot be predicted |
| d. Supply decreases; demand remains constant. | (circle the right one) Decrease Increase Cannot be predicted | (circle the right one) Decrease Increase Cannot be predicted |
| e. Demand increases; supply increases. | (circle the right one) Increase Decrease Cannot be predicted | (circle the right one) Increase Cannot be predicted Decrease |
| f. Demand decreases; supply decreases. | (circle the right one) Cannot be predicted Decrease Increase | (circle the right one) Decrease Increase Cannot be predicted |
| g. Demand increases; supply decreases. | (circle the right one) Decrease Increase Cannot be predicted | (circle the right one) Increase Cannot be predicted Decrease |
| h. Demand decreases; supply increases. | (circle the right one) Cannot be predicted Increase Decrease | (circle the right one) Increase Decrease Cannot be predicted |
Q2.Using the demand schedule in the table below, draw the demand curve for slices of pizza in a college town by plotting each of the 8 points.
Price ($) | Quantity demanded (slices) |
| 0.00 | 350 |
| 0.50 | 300 |
| 1.00 | 250 |
| 1.50 | 200 |
| 2.00 | 150 |
| 2.50 | 100 |
| 3.00 | 50 |
| 3.50 | 0 |
Instructions: Use the tool provided (Demand) to plot the line point by point (8 points total).
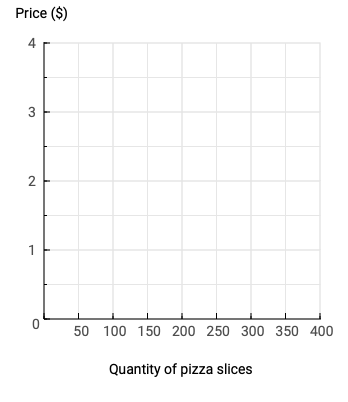
Price ($) 4 3 0 50 100 150 200 250 300 350 400 Quantity of pizza slices
Step by Step Solution
There are 3 Steps involved in it

Get step-by-step solutions from verified subject matter experts