

Question: Q1. (Line fitting) Write a python code to do the following operations. 1. Define a function raw_data_linear_generator(slope, intercept, xmin, xmax, ystddev, num_points) to generate raw
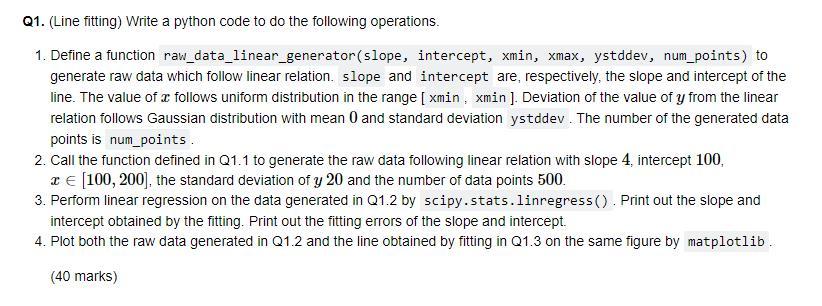
Q1. (Line fitting) Write a python code to do the following operations. 1. Define a function raw_data_linear_generator(slope, intercept, xmin, xmax, ystddev, num_points) to generate raw data which follow linear relation slope and intercept are, respectively, the slope and intercept of the line. The value of x follows uniform distribution in the range [ xmin , xmin ). Deviation of the value of y from the linear relation follows Gaussian distribution with mean 0 and standard deviation ystddev. The number of the generated data points is num_points. 2. Call the function defined in Q1.1 to generate the raw data following linear relation with slope 4. intercept 100, 1e [100, 200), the standard deviation of y 20 and the number of data points 500. 3. Perform linear regression on the data generated in Q1.2 by scipy.stats.linregress (). Print out the slope and intercept obtained by the fitting. Print out the fitting errors of the slope and intercept. 4. Plot both the raw data generated in Q1.2 and the line obtained by fitting in Q1.3 on the same figure by matplotlib. (40 marks) Q1. (Line fitting) Write a python code to do the following operations. 1. Define a function raw_data_linear_generator(slope, intercept, xmin, xmax, ystddev, num_points) to generate raw data which follow linear relation slope and intercept are, respectively, the slope and intercept of the line. The value of x follows uniform distribution in the range [ xmin , xmin ). Deviation of the value of y from the linear relation follows Gaussian distribution with mean 0 and standard deviation ystddev. The number of the generated data points is num_points. 2. Call the function defined in Q1.1 to generate the raw data following linear relation with slope 4. intercept 100, 1e [100, 200), the standard deviation of y 20 and the number of data points 500. 3. Perform linear regression on the data generated in Q1.2 by scipy.stats.linregress (). Print out the slope and intercept obtained by the fitting. Print out the fitting errors of the slope and intercept. 4. Plot both the raw data generated in Q1.2 and the line obtained by fitting in Q1.3 on the same figure by matplotlib. (40 marks)
Step by Step Solution
There are 3 Steps involved in it

Get step-by-step solutions from verified subject matter experts