

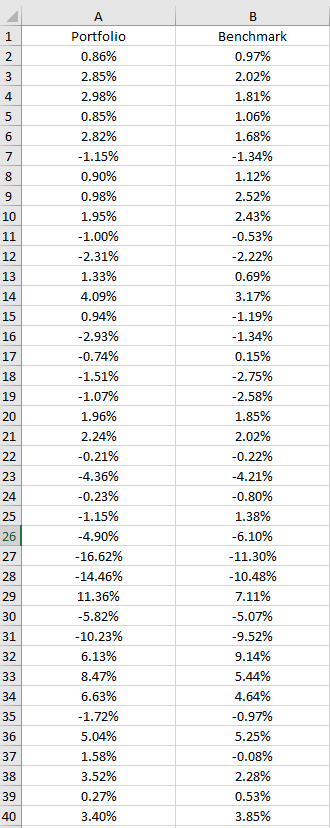
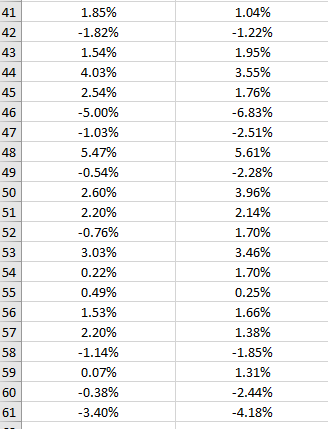
Question: Q1. Monthly return data for a portfolio and its benchmark is provided excel. Calculate the over or under performance of the portfolio against the benchmark.
Q1. Monthly return data for a portfolio and its benchmark is provided excel. Calculate the over or under performance of the portfolio against the benchmark.
1)-0.24% per month 2)-1.2% per month 3)0.18% per month
4)0.06% per month 5)-0.3%% per month
Q2.Calculate the following risk measures for the portfolio:
(i) Volatility
(ii) Probability of a return below -2% per month.
(iii) Value at Risk at 90% using the non-parametric method.
1.(i) 1.8%; (ii) 16.7%; (iii) -7.24%
2.(i) 3.89%; (ii) 23.3%; (iii) -4.29%
3.(i) 0.8%; (ii) -6.7%; (iii) -0.5%
4.(i) 4.5%; (ii) 16.7%; (iii) -4.41%
5.(i) 0.24%; (ii) 2.5%; (iii) 1.5%
Q3. Monthly returns for the portfolio and its benchmark in excel.
You are required to calculate the relative risk of the portfolio against the benchmark using an OLS regression.
1)1.58%
2)2.5%
3)0.54%
4)1.54%
5)0.2%
Step by Step Solution
There are 3 Steps involved in it

Get step-by-step solutions from verified subject matter experts