

Question: Q1. Perform a one-sample t- test using SPSS. (9 points) I am shopping for a new sedan and would like to get one with excellent
Q1. Perform a one-sample t-test using SPSS.(9 points)
I am shopping for a new sedan and would like to get one with excellent miles per gallon (MPG).I heard that Japanese cars tend to be more fuel efficient than American cars, so I collected MPG data on a random sample of 15 Japanese sedan models (listed in the table below) to be compared to the American car statistics. The US Environmental Protection Agency reported that the average MPG for American sedans in 2022 is= 26.5 (comparison population mean). Using a significance level of = .05, determine whether the sample data suggests that the MPG for Japanese cars is statistically significantly greater than the MPG for American cars. Note: You will need to import this data into SPSS.
Round to 3 decimal places. If the answer has only 1 or 2 decimal places you do not need to add a zero to make it 3.
| Japanese car model | MPG |
| 1 | 35 |
| 2 | 30 |
| 3 | 32 |
| 4 | 36 |
| 5 | 34 |
| 6 | 28 |
| 7 | 38 |
| 8 | 29 |
| 9 | 30 |
| 10 | 33 |
| 11 | 37 |
| 12 | 32 |
| 13 | 29 |
| 14 | 34 |
| 15 | 36 |
A. What would be the null and alternative hypotheses (i.e., models) in both words and symbol notations for my analysis? (Hint: Consider whether a one-tailed or two-tailed test is needed.)
B. Calculate the sample mean for the Japanese sample. Report the answer with 3 decimal points. (Provide your calculation process.)
C. Estimate the standard deviation of the Japanese car population (s or). (Report the answer with 3 decimal points. Remember to use the formula forProvide your calculation process.)
D. Calculate the t statistic using SPSS and insert a screen shot of the t-test output in SPSS - make sure to indicate what is the t-statistic. Report the answer with 3 decimal points. (Hint: In SPSS make sure to use 26.5 as the test value when running the t-test).
t =
E. What is the p-value based on the t-test?
p-value =
F. What is the conclusion of the hypothesis test (do you "reject" or "fail to reject" the null hypothesis)? What is the rationale?
G. Interpret the result by answering the following question:Do Japanese sedans have statistically significantly higher MPGs compared to American sedans?
Extra Data File for Reference
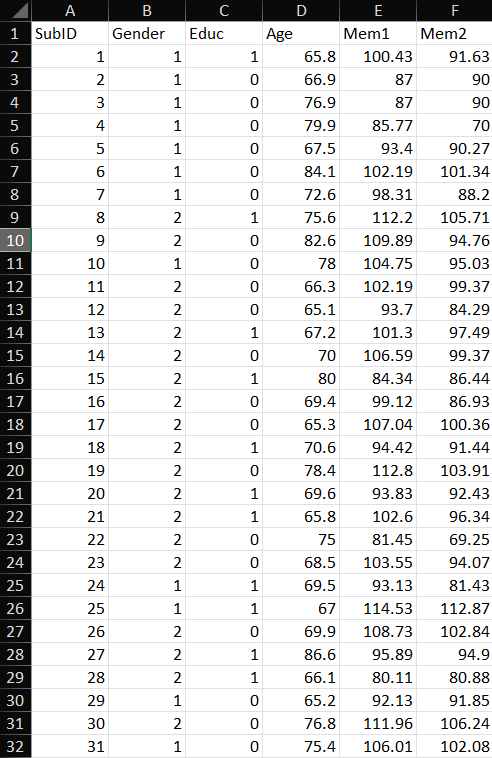
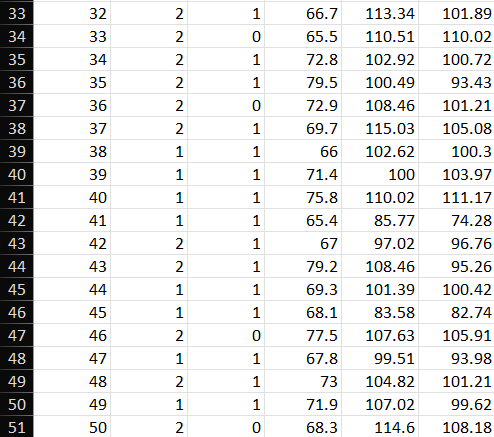
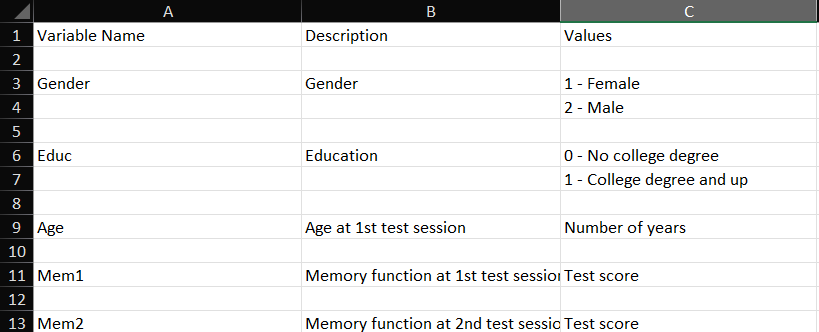
A B C D E F 1 SubID Gender Educ Age Mem1 Mem2 2 1 1 65.8 100.43 91.63 3 2 66.9 87 90 4 3 76.9 87 90 5 79.9 85.77 70 6 0 67.5 93.4 90.27 7 0 84.1 102.19 101.34 0 72.6 98.31 88.2 9 8 1 75.6 112.2 105.71 10 9 0 82.6 109.89 94.76 11 10 0 78 104.75 95.03 12 11 66.3 102.19 99.37 13 12 65.1 93.7 84.29 14 13 67.2 101.3 97.49 15 14 70 106.59 99.37 16 15 1 80 84.34 86.44 17 16 0 69.4 99.12 86.93 H N P N N N P P N N N N N N N N N N N N N N NPPPPPP 18 17 0 65.3 107.04 100.36 19 18 1 70.6 94.42 91.44 20 19 78,4 112.8 103.91 21 20 1 69.6 93.83 92.43 22 21 1 65.8 102.6 96.34 23 22 0 75 81.45 69.25 24 23 0 68.5 103.55 94.07 25 24 1 69.5 93.13 81.43 26 25 1 67 114.53 112.87 27 26 0 69.9 108.73 102.84 28 27 86.6 95.89 94.9 29 28 66.1 80.11 80.88 30 29 65.2 92.13 91.85 31 30 76.8 111.96 106.24 B2 31 75.4 106.01 102.08\fA B C 1 Variable Name Description Values 2 3 Gender Gender 1 - Female 4 2 - Male 5 6 Educ Education 0 - No college degree 7 1 - College degree and up 8 9 Age Age at 1st test session Number of years 10 11 Mem1 Memory function at 1st test session Test score 12 13 Mem2 Memory function at 2nd test sessio Test score
Step by Step Solution
There are 3 Steps involved in it

Get step-by-step solutions from verified subject matter experts