

Question: Q1- production and cost table. Plot the ATC, AVC, and MC curves on the graph. AP TFC TVC TC AFC ATC AVC MC Labor Output
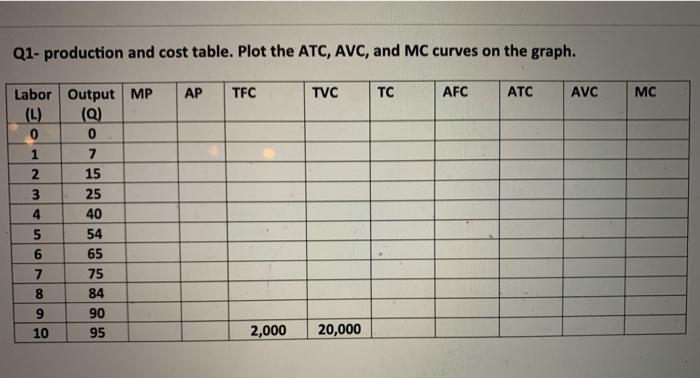
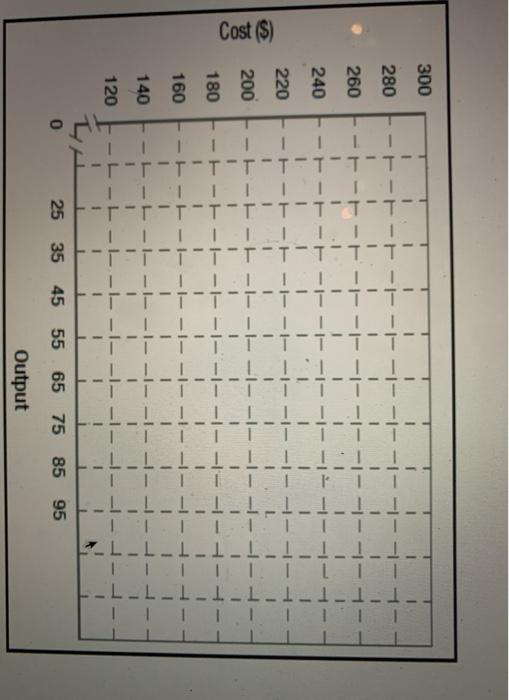
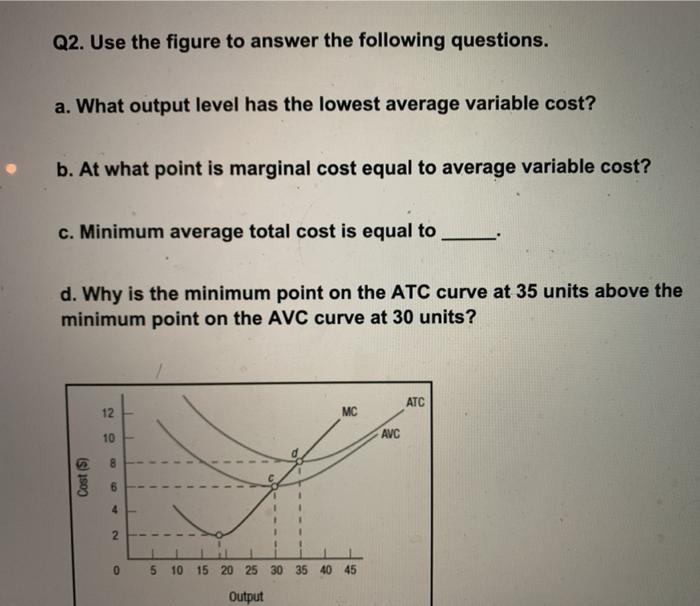
Q1- production and cost table. Plot the ATC, AVC, and MC curves on the graph. AP TFC TVC TC AFC ATC AVC MC Labor Output MP (L) (Q) 0 1 7 2 15 3 25 4 40 5 54 6 65 7 75 8 84 9 90 10 95 2,000 20,000 300 280 260 240 220 Cost ($) 200 180 160 1 1 1 140 120 L-I --I --I--I--I- 1 1 1 25 35 45 55 65 75 85 0 95 Output Q2. Use the figure to answer the following questions. a. What output level has the lowest average variable cost? b. At what point is marginal cost equal to average variable cost? c. Minimum average total cost is equal to __ d. Why is the minimum point on the ATC curve at 35 units above the minimum point on the AVC curve at 30 units? ATC 12 MC 10 AVC 8 Cost (5) 6 1 1 4 1 1 2 0 5 10 15 20 25 30 35 40 45 Output
Step by Step Solution
There are 3 Steps involved in it

Get step-by-step solutions from verified subject matter experts