

Question: Q.1 Refer to the data set SDBRIDGE.exe. The data is about structurally deficient highway bridges compiled by the Federal Highway Administration (FHWA) into the National
Q.1 Refer to the data set SDBRIDGE.exe.
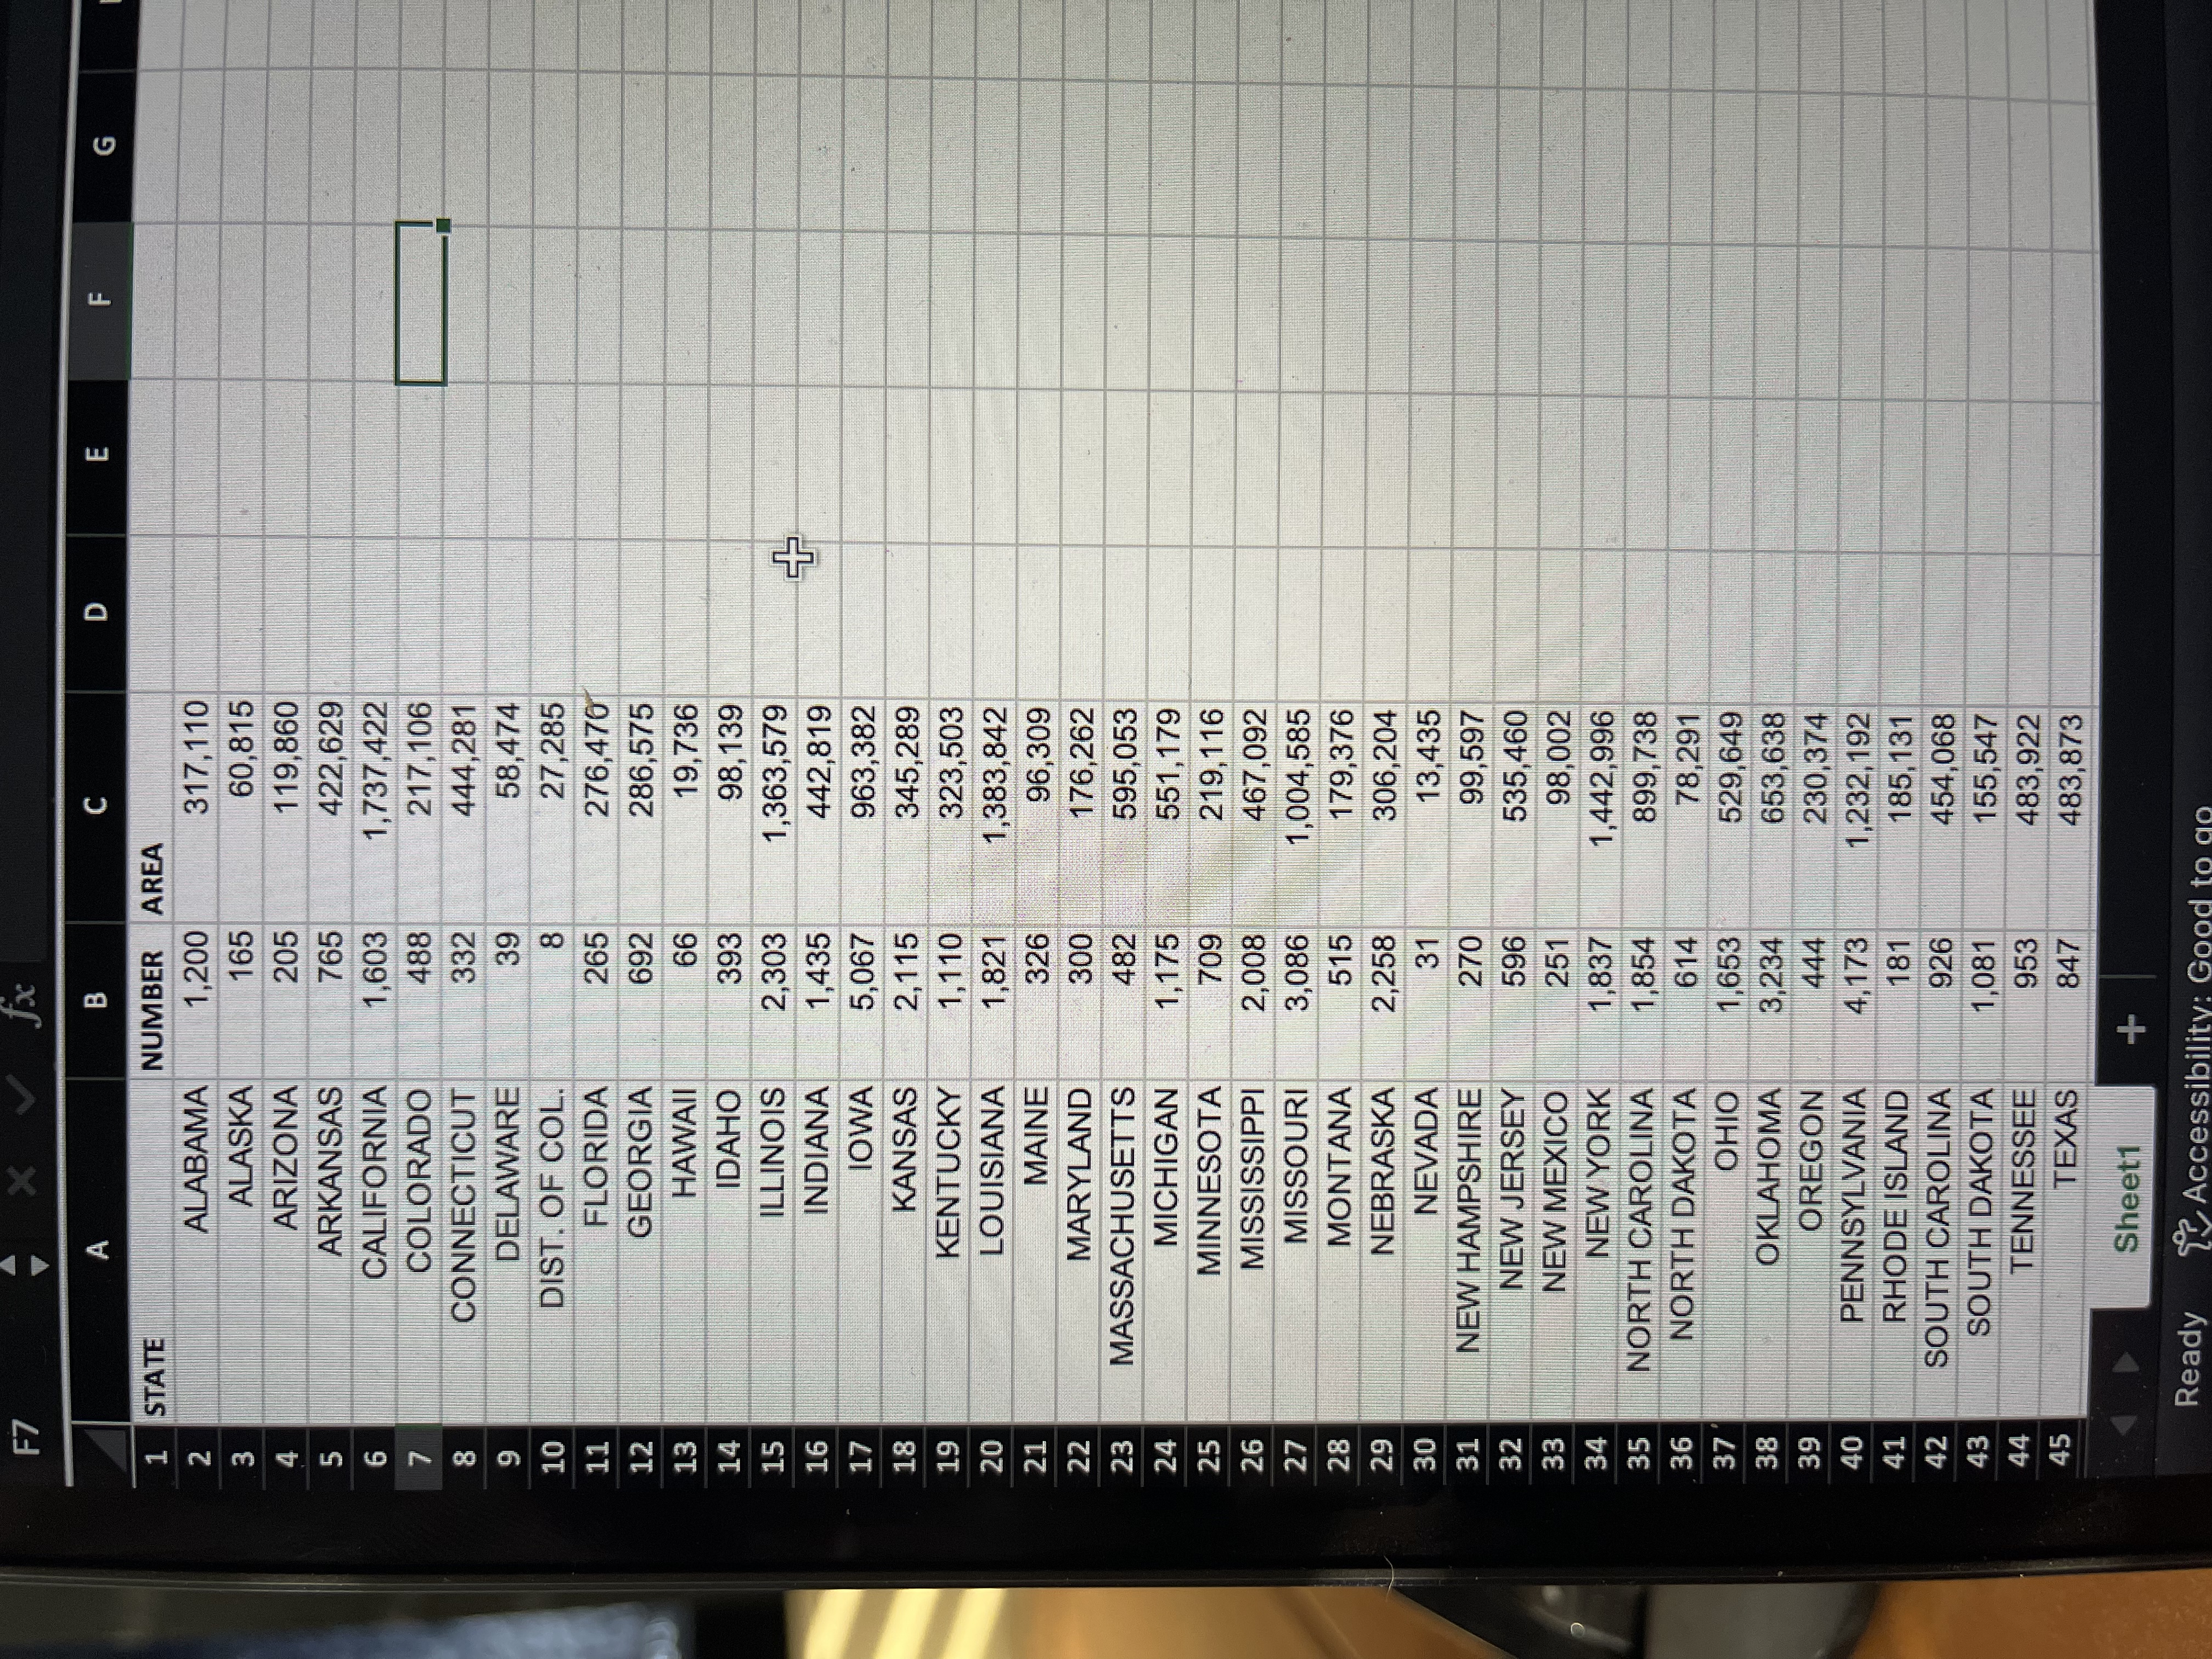
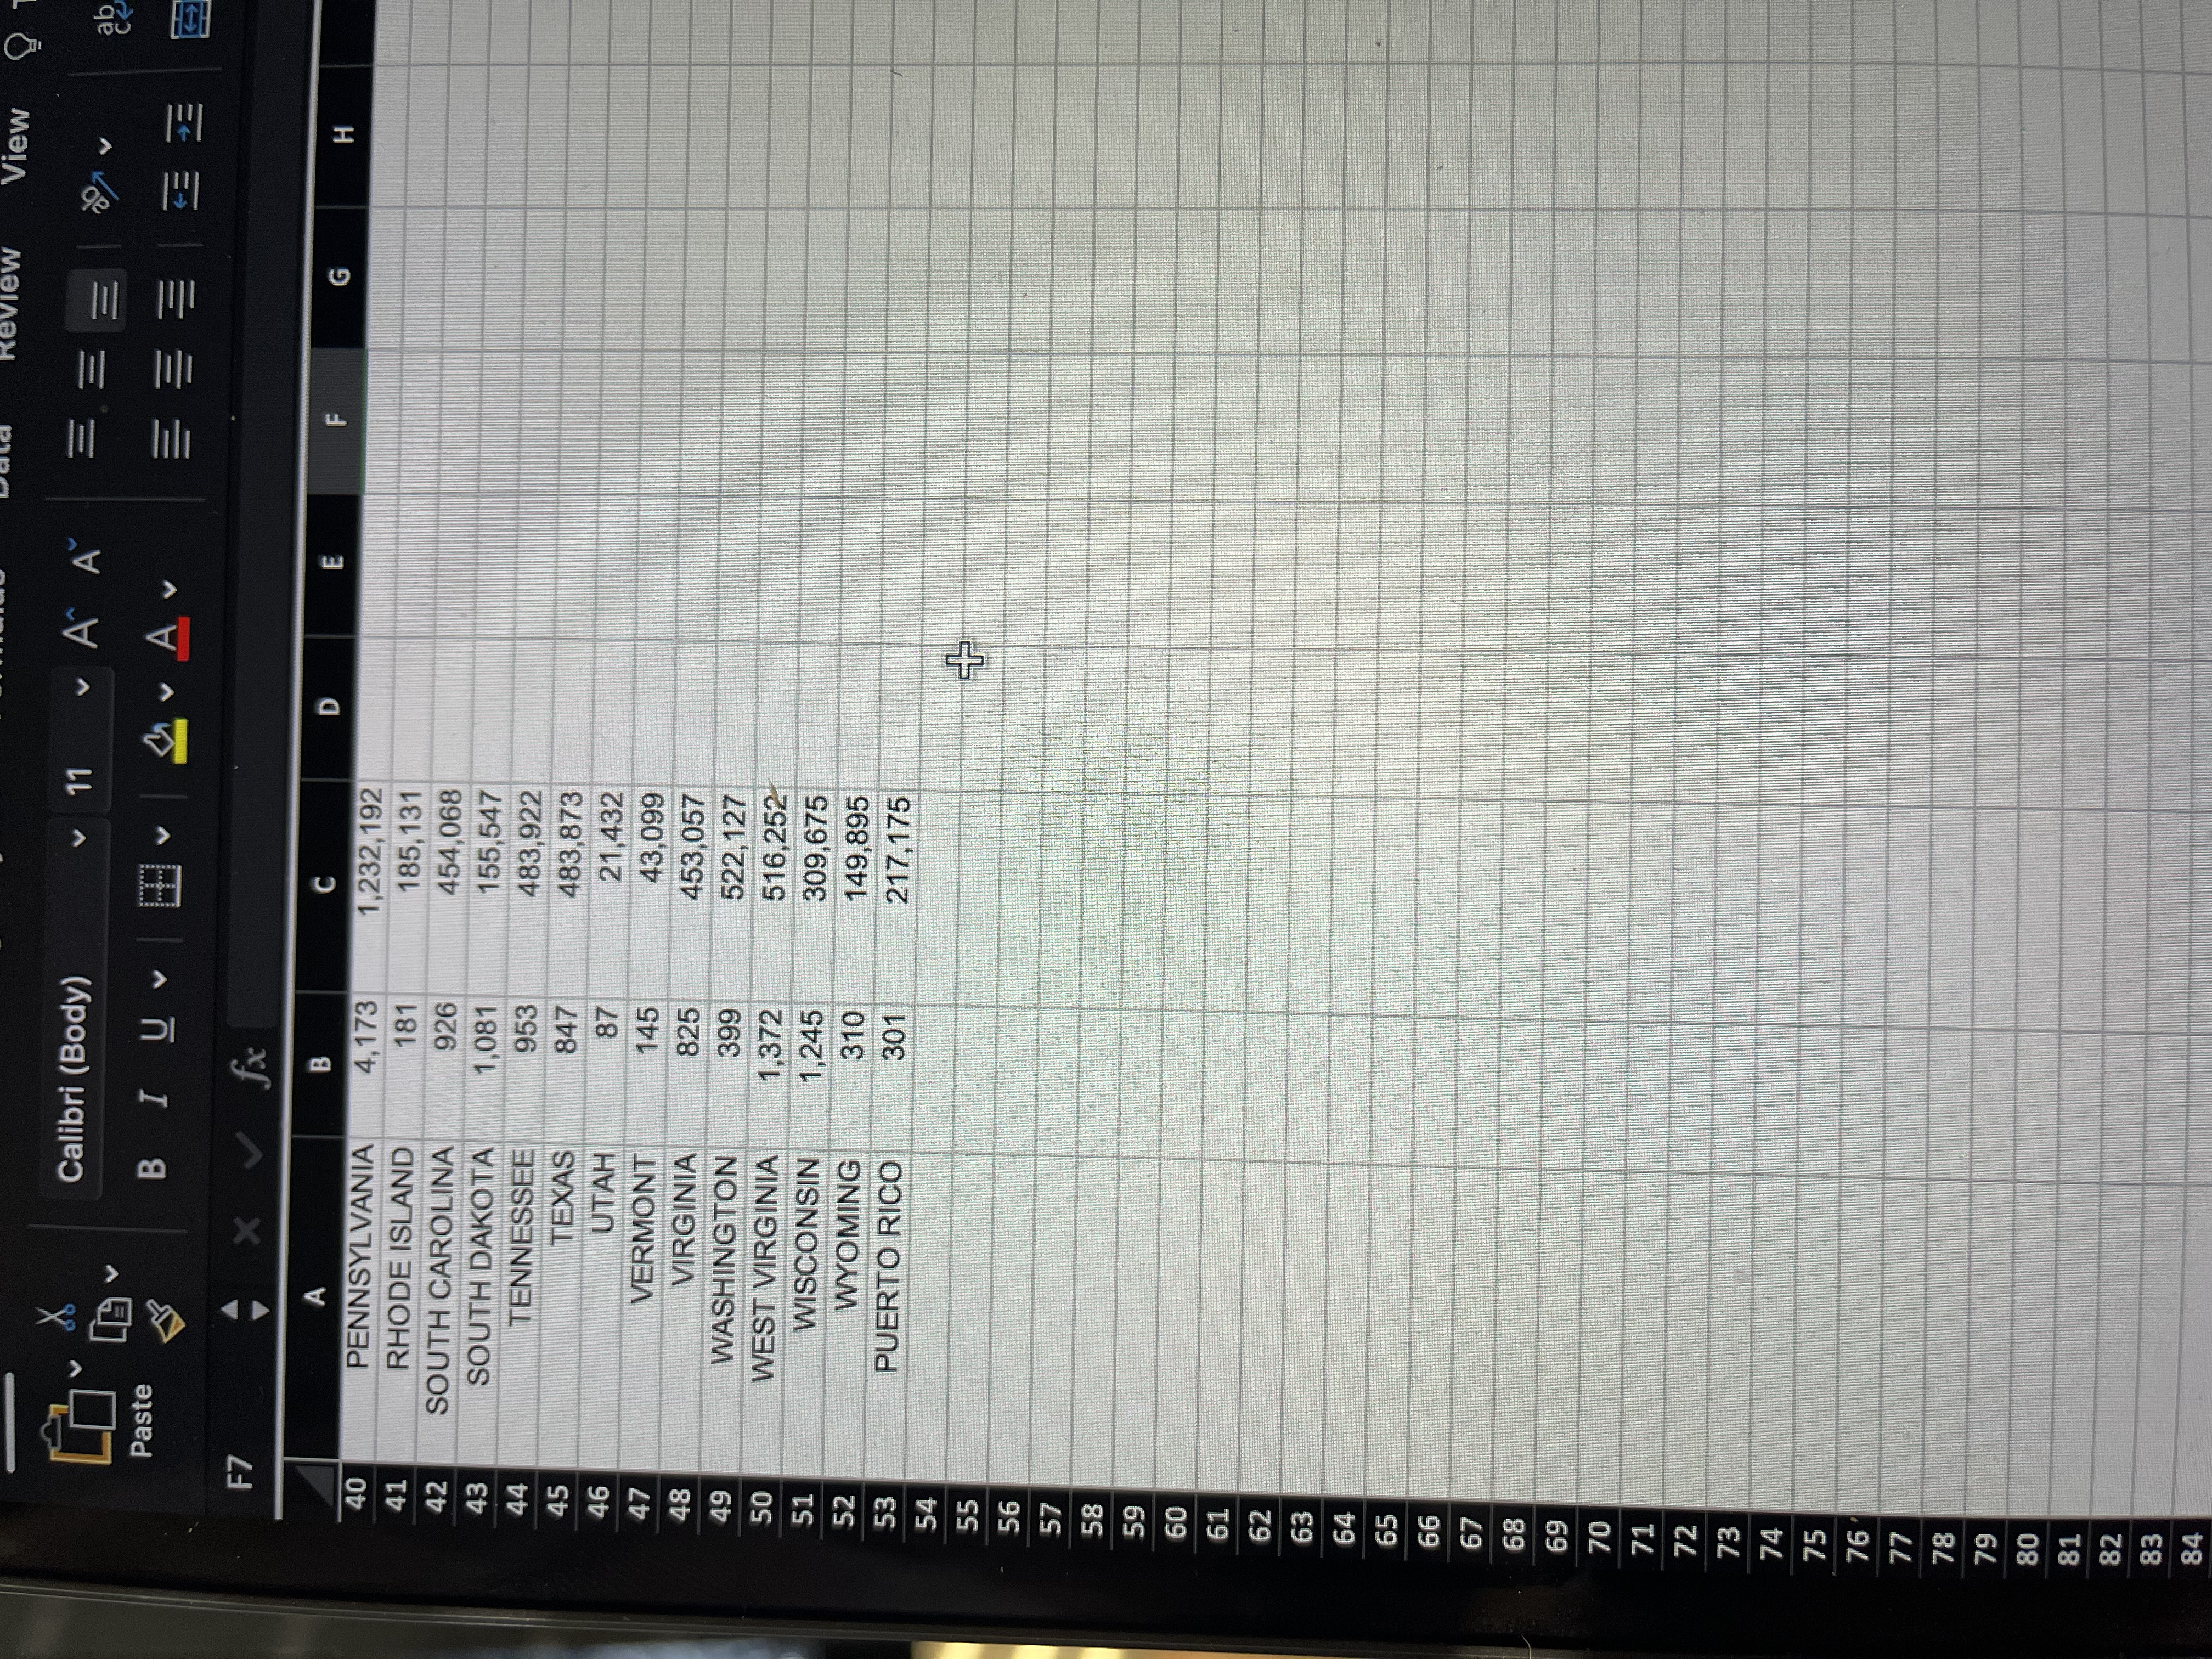
The data is about structurally deficient highway bridges compiled by the Federal Highway Administration (FHWA) into the National Bridge Inventory (NBI). For each state, the NBI lists the number of structurally deficient bridges and the total area (thousands of square meters) of the deficient bridges. The data for the 50 states (plus the District of Columbia and Puerto Rico) are saved in the file. (The first five and last five observations are listed in the table.) For future planning and budgeting, the FHWA wants to estimate the total area of structurally deficient bridges in a state based on the number of deficient bridges.
- Write the equation of a straight-line model relating total area (y) to number of structurally deficient bridges (x).
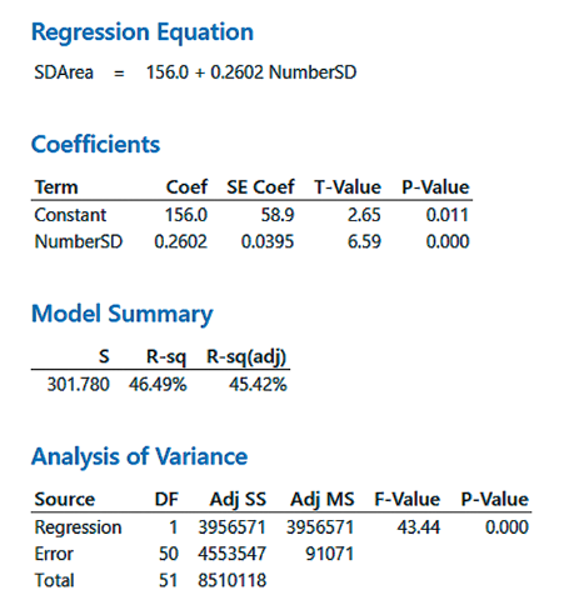
- The model, part a, was fit to the data using Minitab, as shown below. Find the least squares prediction equation on the printout.
- Locate the estimated standard error of the regression model, s, on the printout.
- Use the value of s to find a range where most (about 95%) of the errors of prediction will fall.
How to solve this in EXCEL?
LINK to the EXCEL DATA
https://docs.google.com/spreadsheets/d/1ukn2rdbz9yleaKauQkOmvRqW2caNiAOS/edit?usp=sharing&ouid=105120223250447954809&rtpof=true&sd=true

Regression Equation SDArea = 156.0 + 0.2602 NumberSD Coefficients Term Coef SE Coef T-Value P-Value Constant 156.0 58.9 2.65 0.011 NumberSD 0.2602 0.0395 6.59 0.000 Model Summary S R-sq R-sq(adj) 301.780 46.49% 45.42% Analysis of Variance Source DF Adj SS Adj MS F-Value P-Value Regression 1 3956571 3956571 43.44 0.000 Error 50 4553547 91071 Total 51 8510118
Step by Step Solution
There are 3 Steps involved in it

Get step-by-step solutions from verified subject matter experts