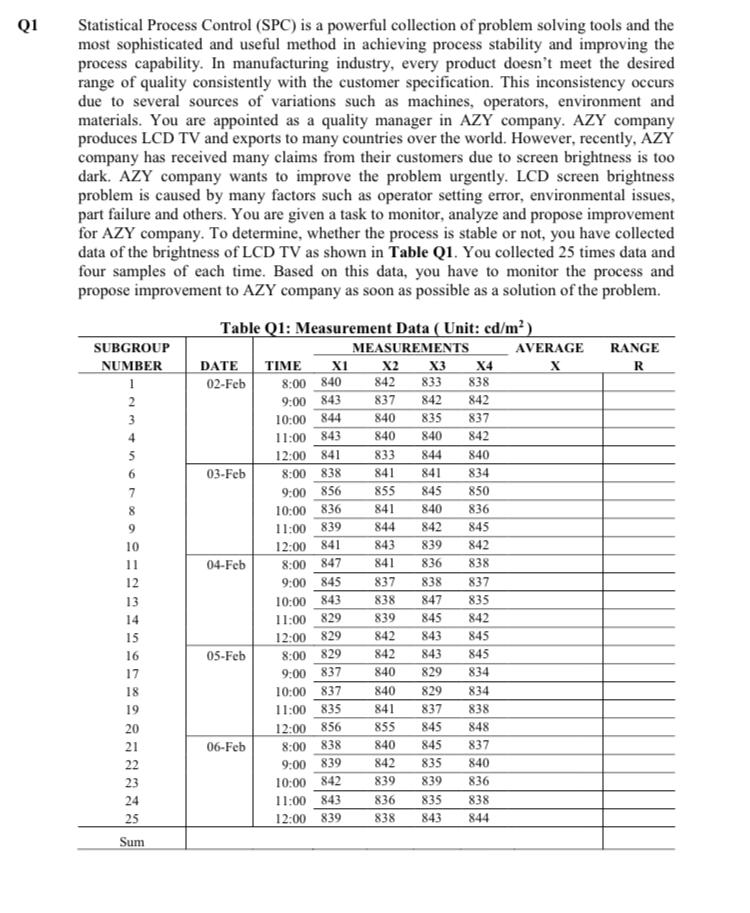
Question: Q1 Statistical Process Control (SPC) is a powerful collection of problem solving tools and the most sophisticated and useful method in achieving process stability and

Q1 Statistical Process Control (SPC) is aQ1 Statistical Process Control (SPC) is a

Q1 Statistical Process Control (SPC) is a powerful collection of problem solving tools and the most sophisticated and useful method in achieving process stability and improving the process capability. In manufacturing industry, every product doesn't meet the desired range of quality consistently with the customer specification. This inconsistency occurs due to several sources of variations such as machines, operators, environment and materials. You are appointed as a quality manager in AZY company. AZY company produces LCD TV and exports to many countries over the world. However, recently, AZY company has received many claims from their customers due to screen brightness is too dark. AZY company wants to improve the problem urgently. LCD screen brightness problem is caused by many factors such as operator setting error, environmental issues, part failure and others. You are given a task to monitor, analyze and propose improvement for AZY company. To determine, whether the process is stable or not, you have collected data of the brightness of LCD TV as shown in Table Q1. You collected 25 times data and four samples of each time. Based on this data, you have to monitor the process and propose improvement to AZY company as soon as possible as a solution of the problem. SUBGROUP NUMBER RANGE R 2 3 4 6 7 8 9 10 Table Q1: Measurement Data ( Unit: cd/m) MEASUREMENTS AVERAGE DATE TIME X1 X2 X3 X4 X 02-Feb 8:00 840 842 833 838 9:00 843 837 842 842 10:00 844 840 835 837 11:00 843 840 840 842 12:00 841 833 844 840 03-Feb 8:00 838 841 841 834 9:00 856 855 845 850 10:00 836 841 840 836 11:00 839 844 842 845 12:00 841 843 839 842 04-Feb 8:00 847 841 836 838 9:00 845 837 838 837 10:00 838 847 835 11:00 829 839 845 842 12:00 829 842 843 845 05-Feb 8:00 829 842 843 845 9:00 837 840 829 834 10:00 837 840 829 834 11:00 835 841 837 838 12:00 856 855 845 848 06-Feb 8:00 838 840 845 837 9:00 839 842 835 840 10:00 842 839 839 836 11:00 843 836 835 838 12:00 839 838 844 843 12 13 14 15 16 17 18 19 20 21 22 23 24 25 843 Sum (h) Analyse the X bar chart whether the process is stable or not based on the result in Q1(f) with justification. (5 marks) (1) Analyse TEN (10) possible causes of the problem through Ishikawa diagram. Apply 4M1E in the answer. (5 marks) 6) Analyse the possible causes through relationship diagram to determine the main causes. (5 marks) (k) Propose FIVE (5) main solutions in details with justification for improving the process through three diagram based on the result in Q1(j) (10 marks)

Step by Step Solution

There are 3 Steps involved in it

1 Expert Approved Answer
Step: 1 Unlock blur-text-image
Question Has Been Solved by an Expert!

Get step-by-step solutions from verified subject matter experts

Step: 2 Unlock
Step: 3 Unlock

Students Have Also Explored These Related General Management Questions!