

Question: Q1. The excel file Assignment2_Data.xlsx includes beer retail sales data (Qc) over 52 weeks from January 1, 2015, to December 24, 2015. The variable Qc
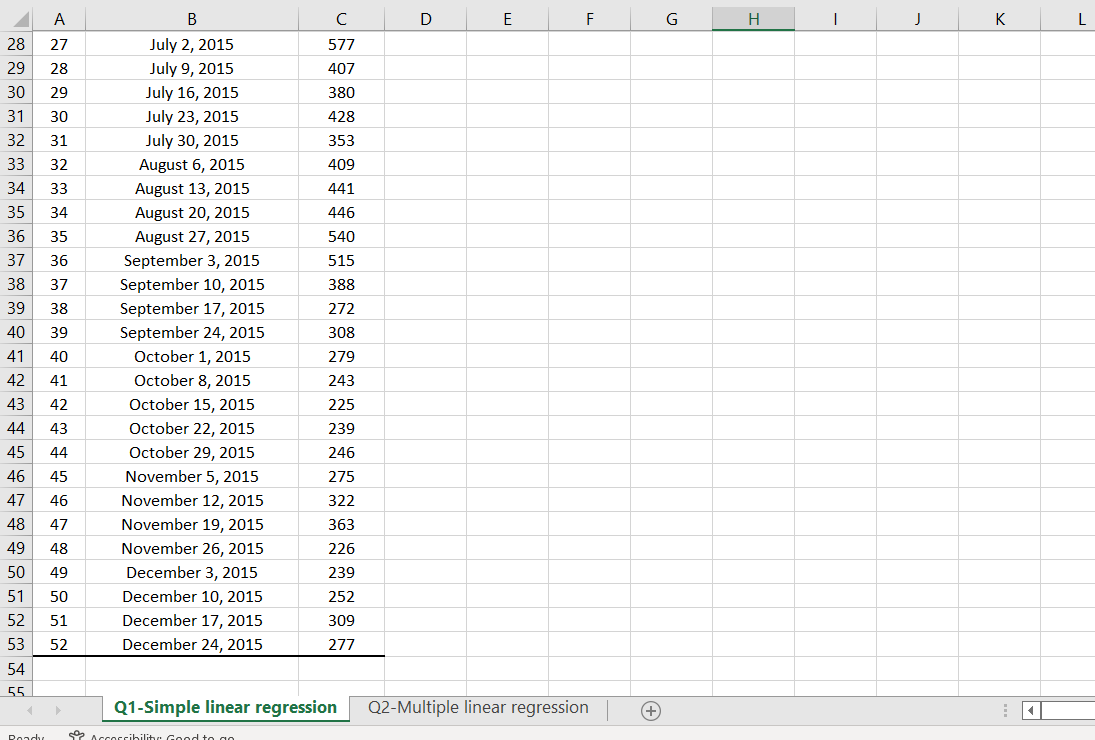
Q1. The excel file "Assignment2_Data.xlsx" includes beer retail sales data (Qc) over 52 weeks from January 1, 2015, to December 24, 2015. The variable Qc represents the total unit sales of the beer (six-packs, in cans, 72oz) across a large number of U.S. retailers. You must forecast future sales. Please send the printout of your excel spreadsheet, including the answers to these questions, with your assignment: 1. (5 points) Report the sales data's mean, median, mode, range, standard deviation, and sample variance. 2. (5 points) Plot the sales data over time, fit a linear trend line to these data and display the regression equation and the R2 for the trend line. 3. (5 points) Using the regression model above, predict the sales for the next period (next 52 weeks). Report the sale in a new column as "Trend forecast." 4. (25 points) Since the above prediction does not account for seasonal fluctuations, the forecasting error may be significant (notice that sales are high in summer). Using the ratio-to-trend method, adjust seasonal fluctuations. To do this, follow the below procedure: I. Predict the sales for the past weeks (Week 1 to 52) using the trend line in part 1. II. Compute the actual to predicted sales ratio for all past weeks by dividing the given Qc by the predicted values for the same week. Report the ratio in a new column as "Differential ratio." III. Calculate the quarterly average differential ratio (the first 13 weeks comprise the first quarter). This is the ratio-to-trend adjustment. Include one data entry for each quarter in a new column with these findings (i.e., four data entries in total). IV. To get the adjusted forecast, multiply the trend forecast for the first and the second 52 weeks by a corresponding quarterly ratio. Report your results in a new column as "Adjusted trend forecast." V. Plot the adjusted trend forecast on the chart over time.
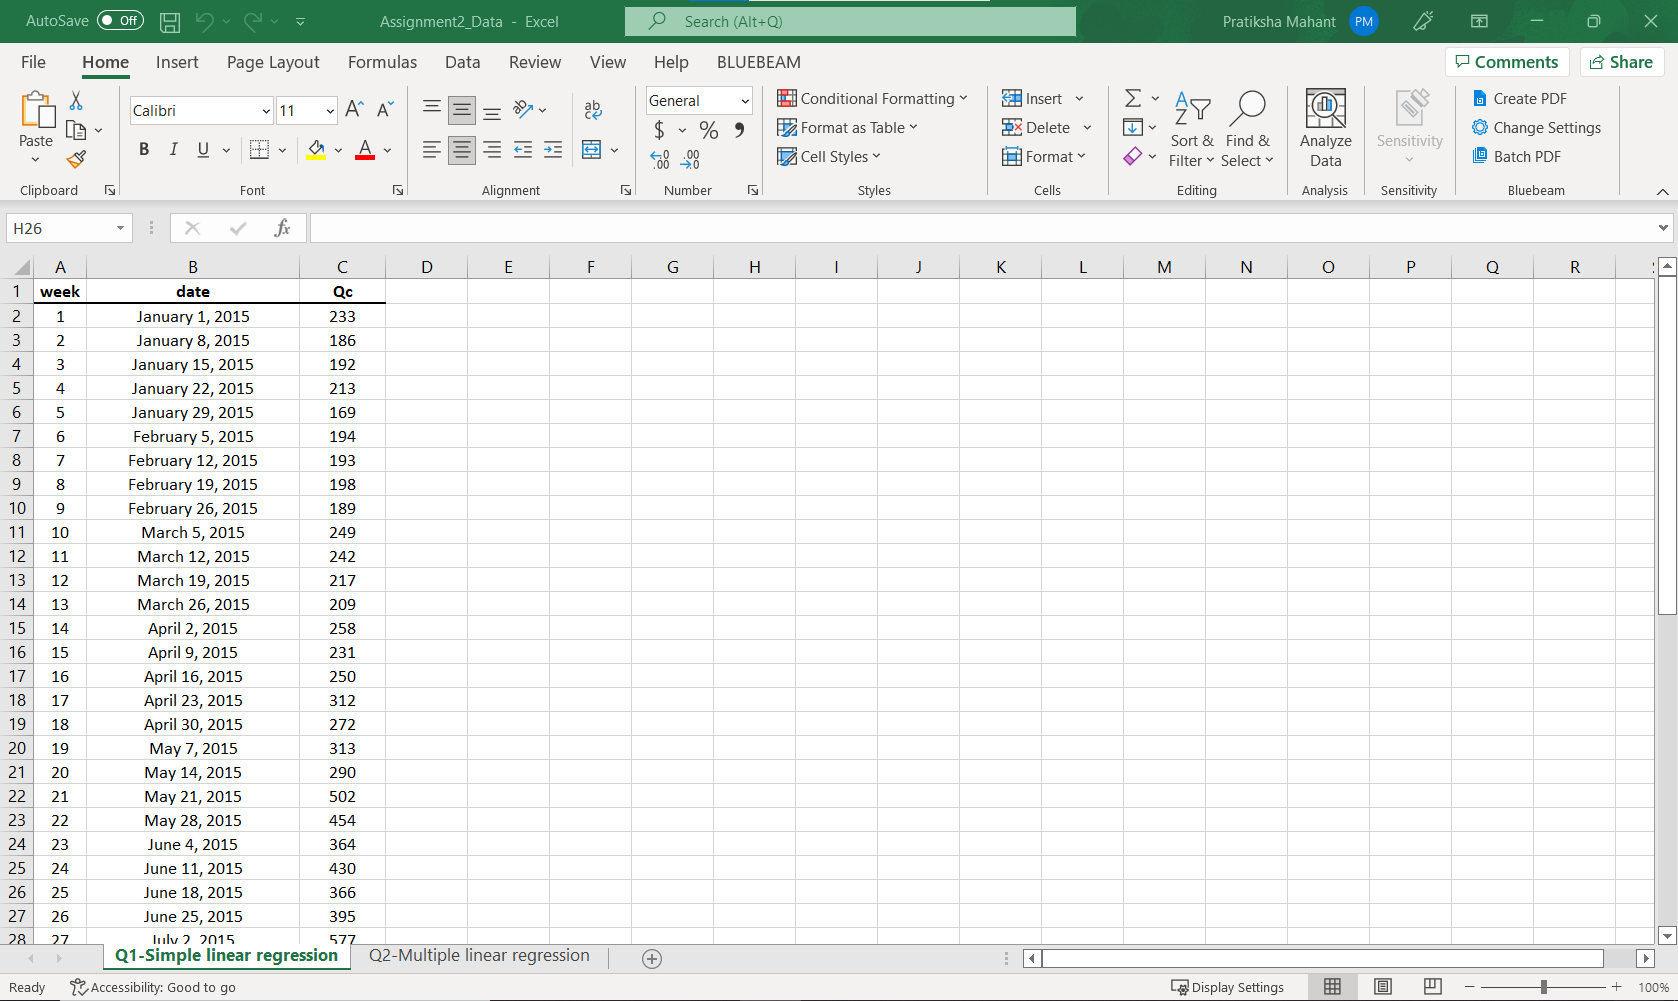
\fAutoSave O Off ) H Assignment2_Data - Excel O Search (Alt+Q) Pratiksha Mahant PM X File Home Insert Page Layout Formulas Data Review View Help BLUEBEAM Comments Share A A ab General Conditional Formatting Insert Ex AYO Create PDF Calibri v 11 $ % " Format as Table Delete IN Change Settings Paste Sort & Find & Analyze Sensitivity BIUTY = Cell Styles Format Filter > Select Data LL Batch PDF Clipboard Font Alignment Number Styles Cells Editing Analysis Sensitivity Bluebeam H26 X Y fx B C D E F G H J K L M N O P Q R week date Qc 1 January 1, 2015 233 MI A W N J January 8, 2015 186 January 15, 2015 192 UPWN January 22, 2015 213 6 January 29, 2015 169 7 6 February 5, 2015 194 8 7 February 12, 2015 193 9 8 February 19, 2015 198 10 9 February 26, 2015 189 11 10 March 5, 2015 249 12 11 March 12, 2015 242 13 12 March 19, 2015 217 14 13 March 26, 2015 209 15 14 April 2, 2015 258 16 15 April 9, 2015 231 17 16 April 16, 2015 250 18 17 April 23, 2015 312 19 18 April 30, 2015 272 20 19 May 7, 2015 313 21 20 May 14, 2015 290 22 21 May 21, 2015 502 23 22 May 28, 2015 454 24 23 June 4, 2015 364 25 24 June 11, 2015 430 26 25 June 18, 2015 366 27 26 June 25, 2015 395 28 27 lulv 7 2015 577 Q1-Simple linear regression Q2-Multiple linear regression + Ready Accessibility: Good to go Display Settings 100%
Step by Step Solution
There are 3 Steps involved in it

Get step-by-step solutions from verified subject matter experts