

Question: Q1) The Figure below shows the progress report chart (or the audit findings) for a sample software project. Briefly explain the figure. In your answer:
Q1) The Figure below shows the progress report chart (or the audit findings) for a sample software project. Briefly explain the figure. In your answer:
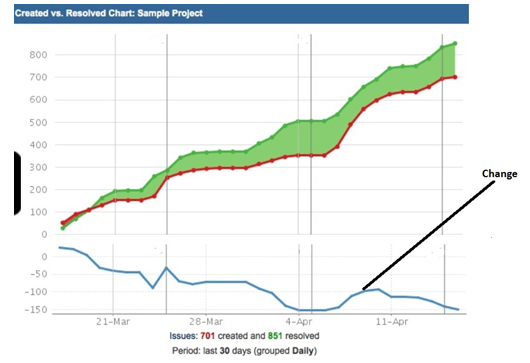
Give a specific title to the figure (other than the one already specified)
Give title to x-axis (horizontal) and y-axis (vertical)
Explain what is shown by the Green and Red lines
Explain the trend shown by the Blue line
+++ please try to write here . don't write in the pic+++
Created vs. Resolved Chart: Sample Project 800 700 600 500 400 300 200 100 Change -50 -100 -150 21-Mar 28-Mar 4-Apr 11-Apr Issues: 701 created and 851 resolved Period: last 30 days (grouped Daily)
Step by Step Solution
There are 3 Steps involved in it
1 Expert Approved Answer
Step: 1 Unlock

Question Has Been Solved by an Expert!
Get step-by-step solutions from verified subject matter experts
Step: 2 Unlock
Step: 3 Unlock