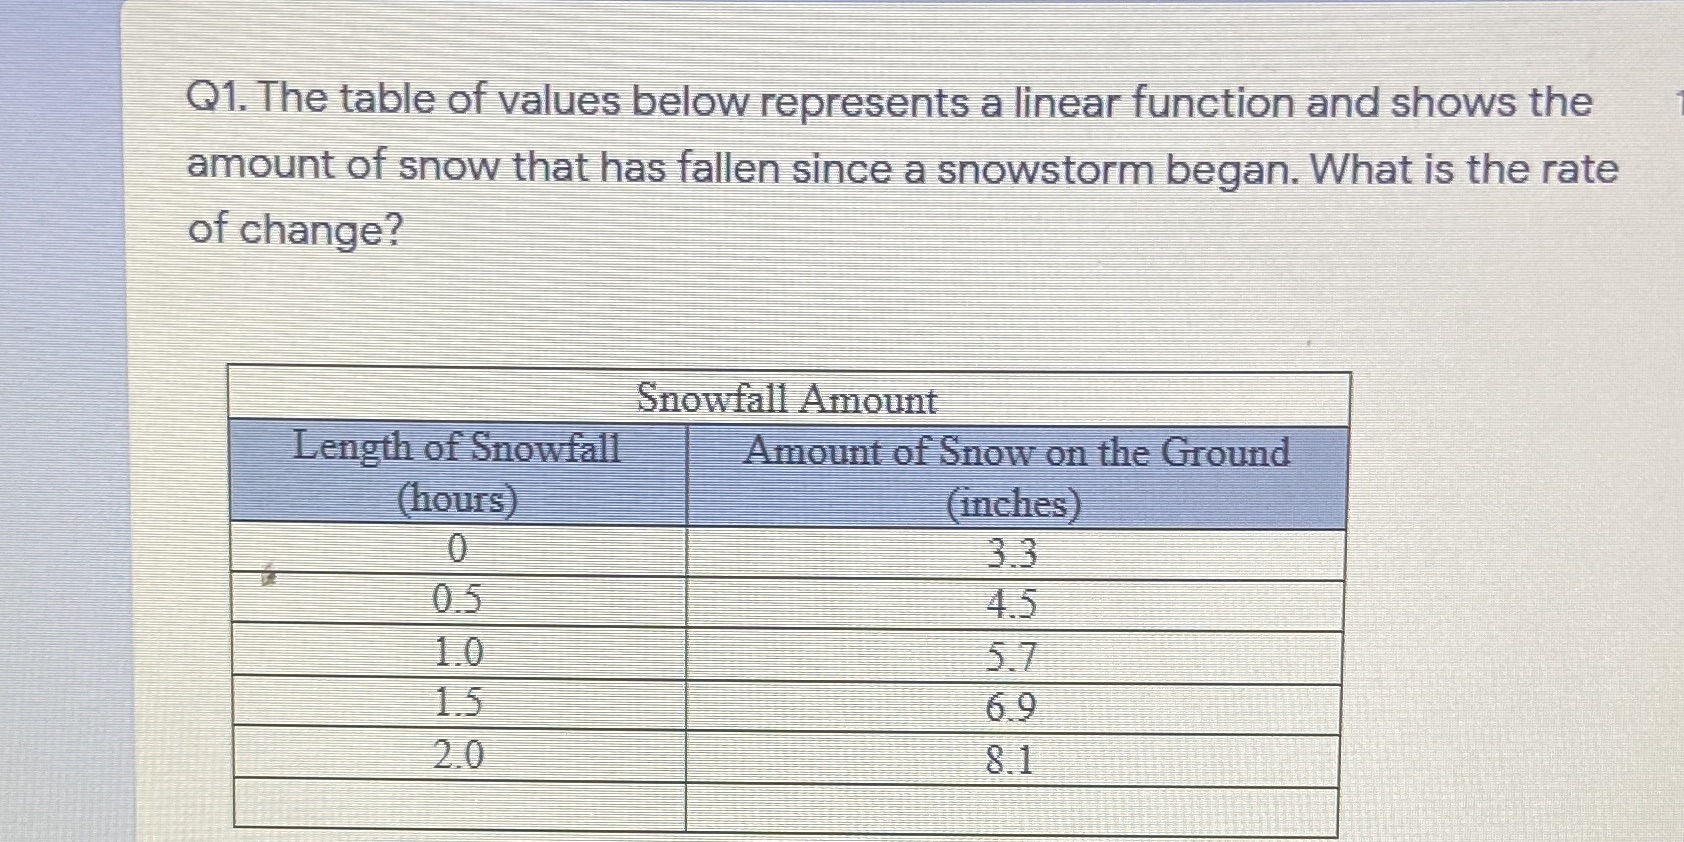
Question: Q1. The table of values below represents a linear function and shows the amount of snow that has fallen since a snowstorm began. What is

Q1. The table of values below represents a linear
Q1. The table of values below represents a linear function and shows the amount of snow that has fallen since a snowstorm began. What is the rate of change? Snowfall Amount Length of Snowfall Amount of Snow on the Ground (hours) (inches) 0 3.3 0.5 4.5 1.0 5.7 1.5 6.9 2.0 8.1

Step by Step Solution

There are 3 Steps involved in it

1 Expert Approved Answer
Step: 1 Unlock blur-text-image
Question Has Been Solved by an Expert!

Get step-by-step solutions from verified subject matter experts

Step: 2 Unlock
Step: 3 Unlock

Students Have Also Explored These Related Mathematics Questions!