

Question: Q1/ Write a Matlab code to generate and plot the equation and the signal shown in the two branches a and b. Use time vector
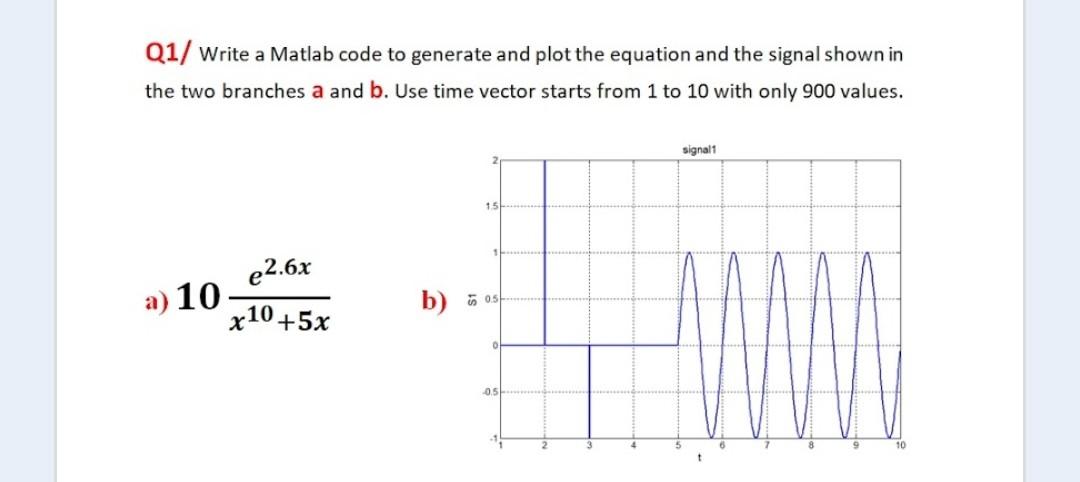
Q1/ Write a Matlab code to generate and plot the equation and the signal shown in the two branches a and b. Use time vector starts from 1 to 10 with only 900 values. signalt 1 1 e2.6x a) 10 b) Gost x10+5x 10
Step by Step Solution
There are 3 Steps involved in it
1 Expert Approved Answer
Step: 1 Unlock

Question Has Been Solved by an Expert!
Get step-by-step solutions from verified subject matter experts
Step: 2 Unlock
Step: 3 Unlock