

Question: Q12. (10 points) Identify the null hypothesis, alternative hypothesis, test statistic, critical value(s), P-value (range of P-value), conclusion about the null hypothesis, and final conclusion
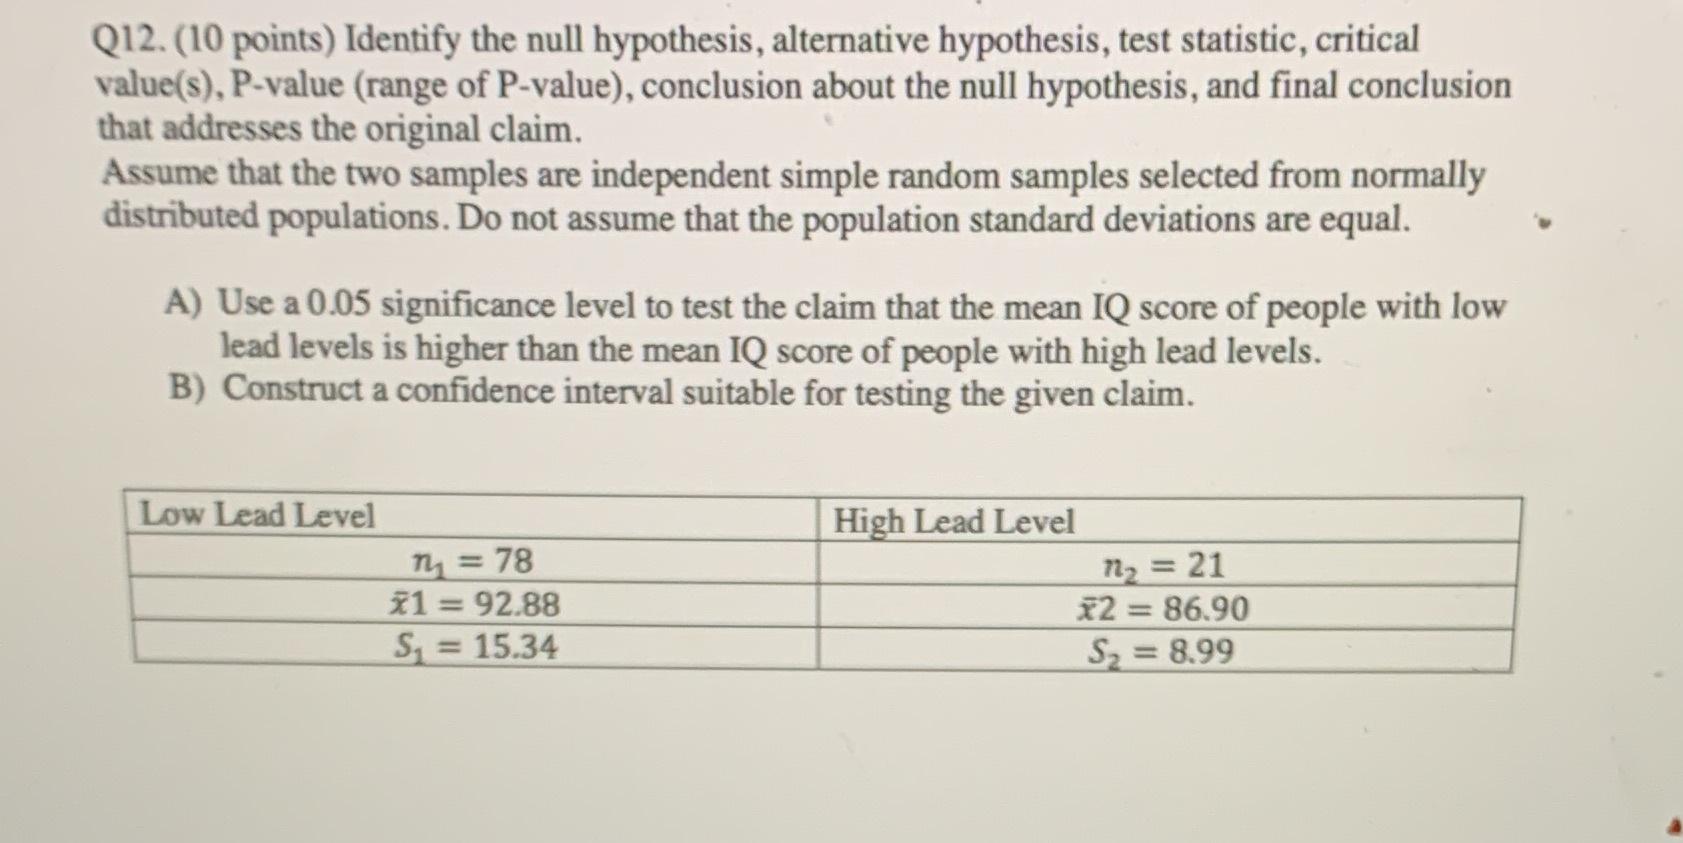

Q12. (10 points) Identify the null hypothesis, alternative hypothesis, test statistic, critical value(s), P-value (range of P-value), conclusion about the null hypothesis, and final conclusion that addresses the original claim. Assume that the two samples are independent simple random samples selected from normally distributed populations. Do not assume that the population standard deviations are equal. A) Use a 0.05 significance level to test the claim that the mean IQ score of people with low lead levels is higher than the mean IQ score of people with high lead levels. B) Construct a confidence interval suitable for testing the given claim. Low Lead Level High Lead Level m = 78 n2 = 21 x1 = 92.88 X2 = 86.90 S1 = 15.34 S2 = 8.99
Step by Step Solution
There are 3 Steps involved in it

Get step-by-step solutions from verified subject matter experts