

Question: Q17 : Why the answer is D ? These questions refer to the following graphs, which are drawn to scale. Ages are in whole years
Q17 : Why the answer is D ?
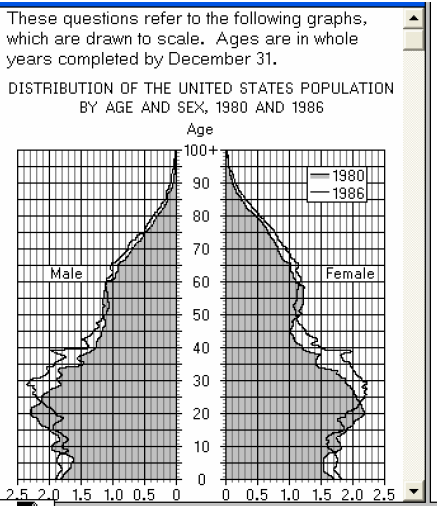
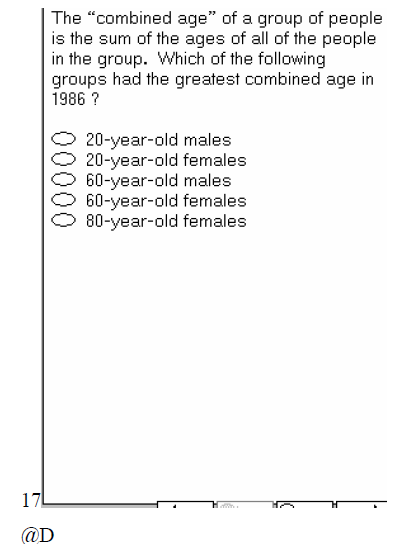
These questions refer to the following graphs, which are drawn to scale. Ages are in whole years completed by December 31. DISTRIBUTION OF THE UNITED STATES POPULATION BY AGE AND SEX, 1980 AND 1986 Age 100+ 90 1980 1986 80 70 Male Female 60 50 40 30 20 10 2.5 20 1.5 1.0 0.5 0 0 0.5 1.0 1.5 2.0 2.5The "combined age" of a group of people is the sum of the ages of all of the people in the group. Which of the following groups had the greatest combined age in 1986 ? 20-year-old males 20-year-old females 00000 60-year-old males 60-year-old females 80-year-old females 17 H OD
Step by Step Solution
There are 3 Steps involved in it
1 Expert Approved Answer
Step: 1 Unlock

Question Has Been Solved by an Expert!
Get step-by-step solutions from verified subject matter experts
Step: 2 Unlock
Step: 3 Unlock