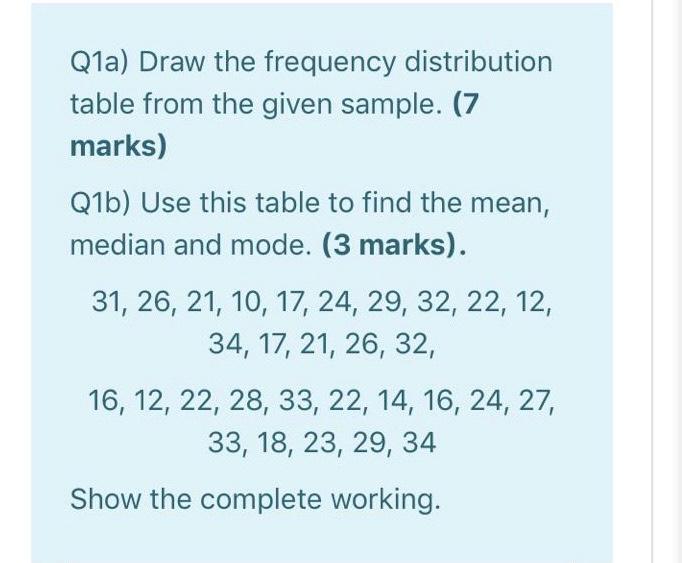
Question: Q1a) Draw the frequency distribution table from the given sample. (7 marks) Q1b) Use this table to find the mean, median and mode. (3 marks).

Q1a) Draw the frequency distribution table from
Q1a) Draw the frequency distribution table from the given sample. (7 marks) Q1b) Use this table to find the mean, median and mode. (3 marks). 31, 26, 21, 10, 17, 24, 29, 32, 22, 12, 34, 17, 21, 26, 32, 16, 12, 22, 28, 33, 22, 14, 16, 24, 27, 33, 18, 23, 29, 34 Show the complete working

Step by Step Solution

There are 3 Steps involved in it

1 Expert Approved Answer
Step: 1 Unlock blur-text-image
Question Has Been Solved by an Expert!

Get step-by-step solutions from verified subject matter experts

Step: 2 Unlock
Step: 3 Unlock

Students Have Also Explored These Related General Management Questions!