

Question: Q2. (10 points) The data shows the roundtrip mileage that 43 randomly selected students drive to school each day. Miles Frequency 10--14 2 15--19 6
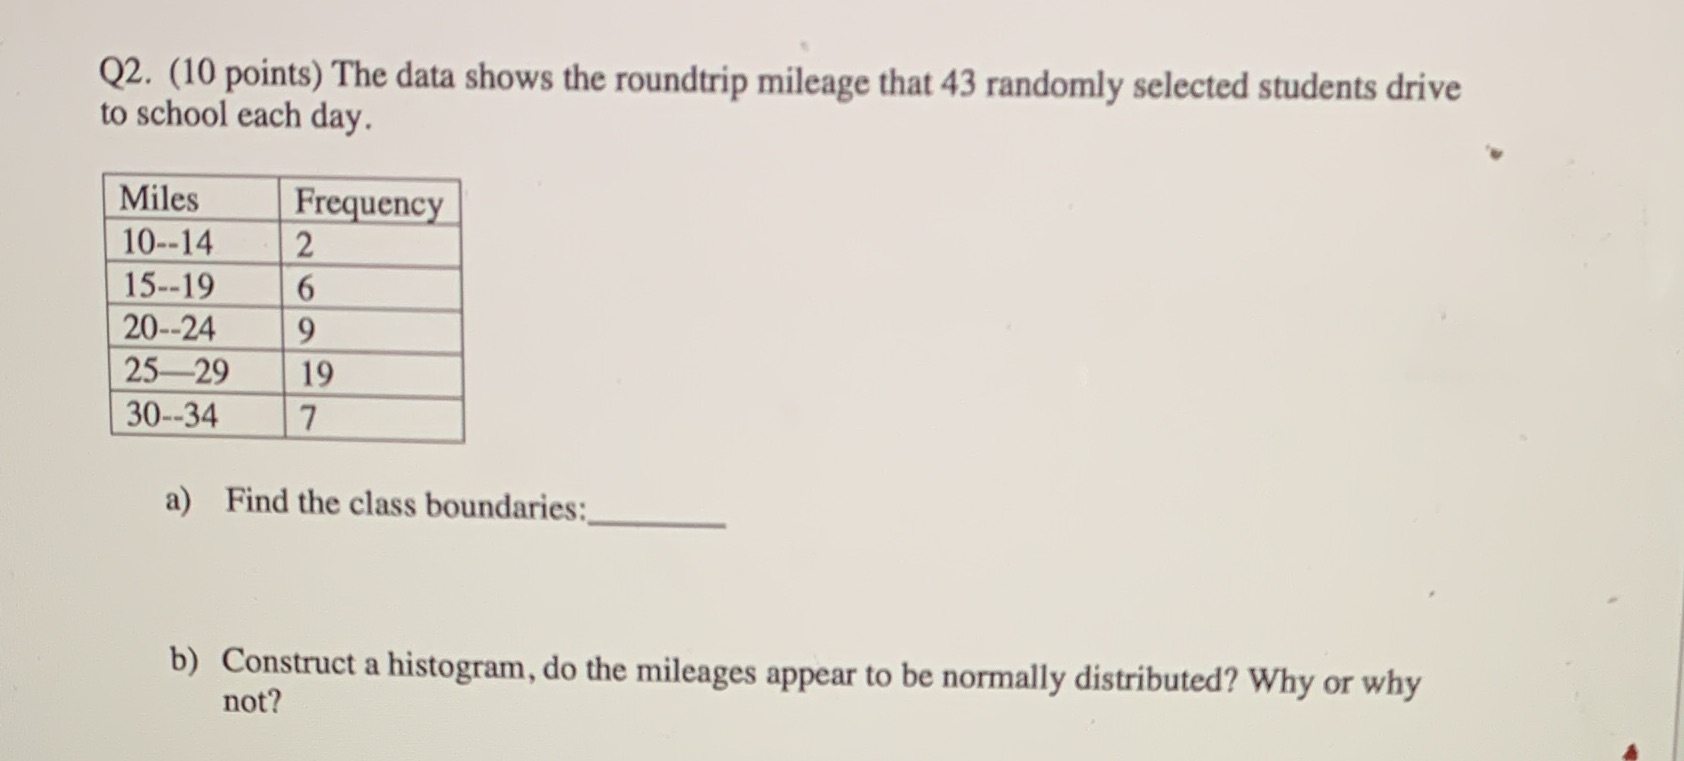
Q2. (10 points) The data shows the roundtrip mileage that 43 randomly selected students drive to school each day. Miles Frequency 10--14 2 15--19 6 20--24 9 25-29 19 30--34 7 a) Find the class boundaries: b) Construct a histogram, do the mileages appear to be normally distributed? Why or why not
Step by Step Solution
There are 3 Steps involved in it
1 Expert Approved Answer
Step: 1 Unlock

Question Has Been Solved by an Expert!
Get step-by-step solutions from verified subject matter experts
Step: 2 Unlock
Step: 3 Unlock